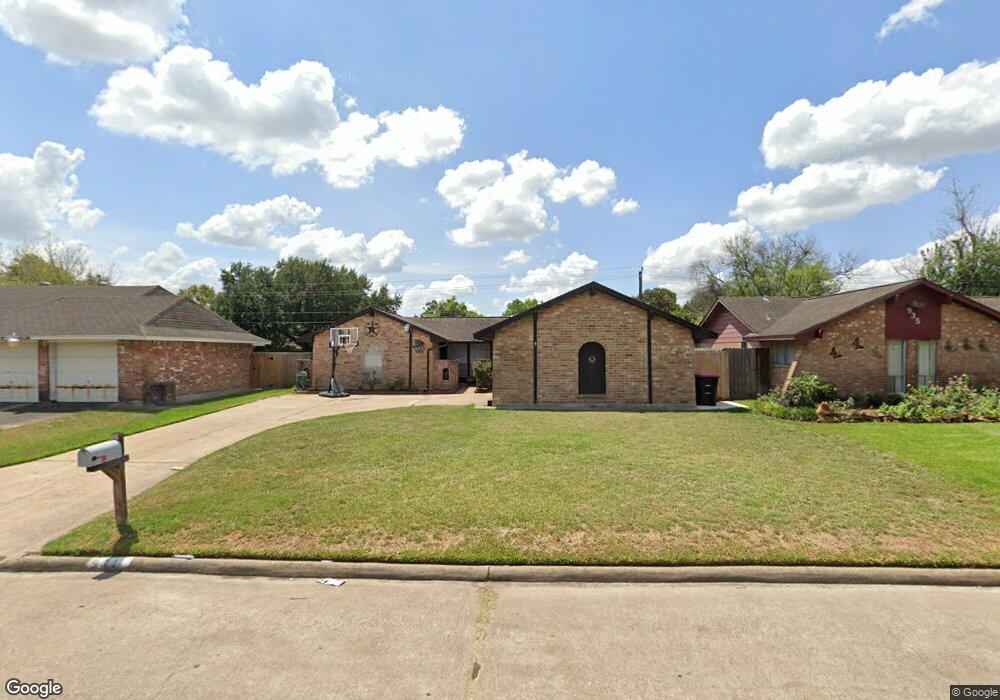
931 Dellbrook Dr Houston, TX 77038
North Houston NeighborhoodEstimated Value: $221,000 - $241,000
3
Beds
2
Baths
1,432
Sq Ft
$162/Sq Ft
Est. Value
About This Home
This home is located at 931 Dellbrook Dr, Houston, TX 77038 and is currently estimated at $231,492, approximately $161 per square foot. 931 Dellbrook Dr is a home located in Harris County with nearby schools including Jerry Keeble Ec/Pre-K, Gray Elementary School, and Aldine Ninth Grade School.
Ownership History
Date
Name
Owned For
Owner Type
Purchase Details
Closed on
Feb 19, 2013
Sold by
Davenport Holly
Bought by
Cardona Olvera Ramon and Moreno Carina
Current Estimated Value
Home Financials for this Owner
Home Financials are based on the most recent Mortgage that was taken out on this home.
Original Mortgage
$68,300
Interest Rate
3.44%
Mortgage Type
New Conventional
Purchase Details
Closed on
Feb 5, 2010
Sold by
Davenport Holly
Bought by
Davenport Holly
Create a Home Valuation Report for This Property
The Home Valuation Report is an in-depth analysis detailing your home's value as well as a comparison with similar homes in the area
Home Values in the Area
Average Home Value in this Area
Purchase History
| Date | Buyer | Sale Price | Title Company |
|---|---|---|---|
| Cardona Olvera Ramon | -- | None Available | |
| Davenport Holly | -- | None Available |
Source: Public Records
Mortgage History
| Date | Status | Borrower | Loan Amount |
|---|---|---|---|
| Previous Owner | Cardona Olvera Ramon | $68,300 |
Source: Public Records
Tax History Compared to Growth
Tax History
| Year | Tax Paid | Tax Assessment Tax Assessment Total Assessment is a certain percentage of the fair market value that is determined by local assessors to be the total taxable value of land and additions on the property. | Land | Improvement |
|---|---|---|---|---|
| 2025 | $4,474 | $231,252 | $32,718 | $198,534 |
| 2024 | $4,474 | $231,252 | $32,718 | $198,534 |
| 2023 | $4,474 | $231,252 | $32,718 | $198,534 |
| 2022 | $4,210 | $182,856 | $27,265 | $155,591 |
| 2021 | $3,678 | $153,188 | $27,265 | $125,923 |
| 2020 | $3,756 | $146,922 | $27,265 | $119,657 |
| 2019 | $3,584 | $134,797 | $27,265 | $107,532 |
| 2018 | $1,838 | $127,997 | $12,510 | $115,487 |
| 2017 | $3,298 | $127,997 | $12,510 | $115,487 |
| 2016 | $2,681 | $104,052 | $12,510 | $91,542 |
| 2015 | $2,189 | $104,052 | $12,510 | $91,542 |
| 2014 | $2,189 | $84,846 | $12,510 | $72,336 |
Source: Public Records
Map
Nearby Homes
- 1022 Progreso Dr
- 939 Point Blank Dr
- 10226 Ella Falls Blvd
- 1010 Francitas Dr
- 1006 Fruitvale Dr
- 1019 Castolan Dr
- 1138 Cherry Spring Dr
- 1219 Pilot Point Dr
- 10134 Lasaber Ct
- 10519 Pleasanton Dr
- 1327 Fallbrook Dr
- 10558 Pleasanton Dr
- 1506 Wilshire Park Dr
- 00 Fallbrook Dr
- 10026 Lasaber Ct
- 0 W Mt Houston Rd Unit 90464120
- 2115 Havencrest Dr
- 2203 Chalet Rd
- 12718 Sai Baba Dr
- 9710 Debbie Ln
- 927 Dellbrook Dr
- 935 Dellbrook Dr
- 930 Pilot Point Dr
- 934 Pilot Point Dr
- 923 Dellbrook Dr
- 939 Dellbrook Dr
- 926 Pilot Point Dr
- 938 Pilot Point Dr
- 930 Dellbrook Dr
- 922 Pilot Point Dr
- 926 Dellbrook Dr
- 934 Dellbrook Dr
- 919 Dellbrook Dr
- 1003 Dellbrook Dr
- 1002 Pilot Point Dr
- 922 Dellbrook Dr
- 938 Dellbrook Dr
- 918 Pilot Point Dr
- 918 Dellbrook Dr
- 1006 Pilot Point Dr