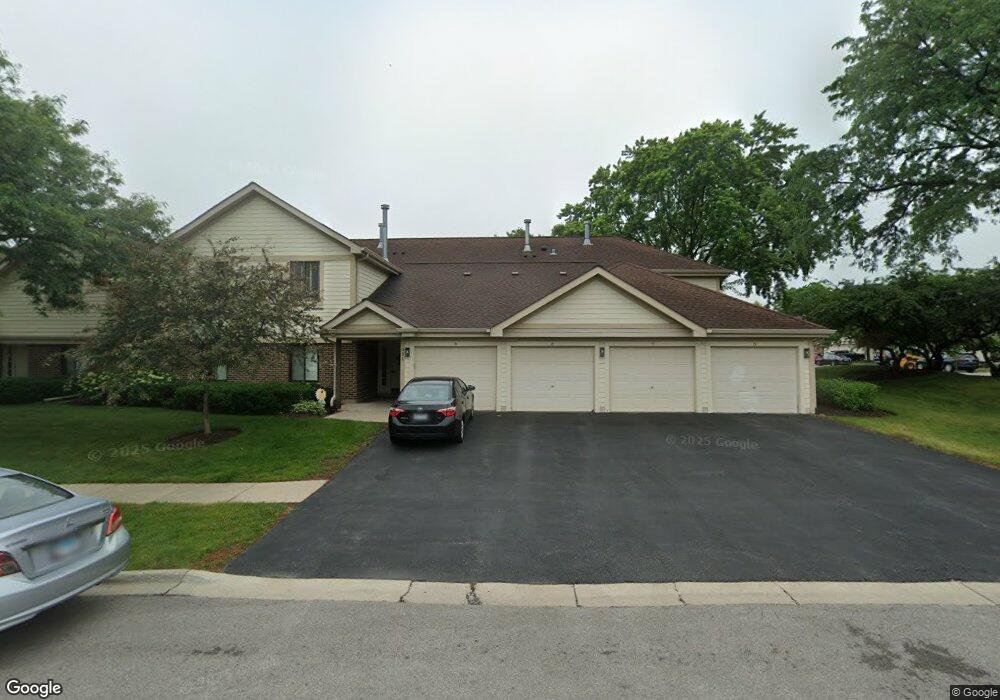
931 E Kings Row Unit 17215 Palatine, IL 60074
Capri Village NeighborhoodEstimated Value: $219,000 - $227,000
2
Beds
--
Bath
900
Sq Ft
$248/Sq Ft
Est. Value
About This Home
This home is located at 931 E Kings Row Unit 17215, Palatine, IL 60074 and is currently estimated at $222,789, approximately $247 per square foot. 931 E Kings Row Unit 17215 is a home located in Cook County with nearby schools including Lake Louise Elementary School, Palatine High School, and Bright Horizons At Motorola-Arlington Hts.
Ownership History
Date
Name
Owned For
Owner Type
Purchase Details
Closed on
Apr 1, 2014
Sold by
Federal Home Loan Mortgage Corporation
Bought by
Goodman Theresa
Current Estimated Value
Purchase Details
Closed on
Jul 10, 2013
Sold by
Holland Richard L
Bought by
Federal Home Loan Mortgage Corporation
Purchase Details
Closed on
Jul 13, 1995
Sold by
Sobotka Henry E and Sobotka Maureen T
Bought by
Speer Beverly L
Home Financials for this Owner
Home Financials are based on the most recent Mortgage that was taken out on this home.
Original Mortgage
$87,800
Interest Rate
7.5%
Mortgage Type
FHA
Create a Home Valuation Report for This Property
The Home Valuation Report is an in-depth analysis detailing your home's value as well as a comparison with similar homes in the area
Home Values in the Area
Average Home Value in this Area
Purchase History
| Date | Buyer | Sale Price | Title Company |
|---|---|---|---|
| Goodman Theresa | $104,500 | Attorneys Title Guaranty Fun | |
| Federal Home Loan Mortgage Corporation | -- | None Available | |
| Speer Beverly L | $91,000 | Attorneys Title Guaranty Fun |
Source: Public Records
Mortgage History
| Date | Status | Borrower | Loan Amount |
|---|---|---|---|
| Previous Owner | Speer Beverly L | $87,800 |
Source: Public Records
Tax History Compared to Growth
Tax History
| Year | Tax Paid | Tax Assessment Tax Assessment Total Assessment is a certain percentage of the fair market value that is determined by local assessors to be the total taxable value of land and additions on the property. | Land | Improvement |
|---|---|---|---|---|
| 2024 | $3,775 | $16,067 | $2,024 | $14,043 |
| 2023 | $3,621 | $16,067 | $2,024 | $14,043 |
| 2022 | $3,621 | $16,067 | $2,024 | $14,043 |
| 2021 | $2,543 | $11,160 | $1,712 | $9,448 |
| 2020 | $2,578 | $11,160 | $1,712 | $9,448 |
| 2019 | $2,603 | $12,505 | $1,712 | $10,793 |
| 2018 | $2,070 | $10,096 | $1,556 | $8,540 |
| 2017 | $2,049 | $10,096 | $1,556 | $8,540 |
| 2016 | $2,155 | $10,096 | $1,556 | $8,540 |
| 2015 | $2,443 | $7,952 | $1,400 | $6,552 |
| 2014 | $1,634 | $7,952 | $1,400 | $6,552 |
| 2013 | $1,574 | $7,952 | $1,400 | $6,552 |
Source: Public Records
Map
Nearby Homes
- 918 E Kings Row Unit 1
- 1010 E Glavin Ct Unit 1807
- 1012 E Glavin Ct Unit 2A
- 847 E Coach Rd Unit 1
- 813 E Carriage Ln Unit 5
- 2024 N Old Hicks Rd Unit B6
- 4220 Bonhill Dr Unit 3E
- 2032 N Wainwright Ct
- 2186 N Oakbrook Cir Unit 3C
- 767 E Whispering Oaks Dr Unit 15
- 1967 N Jamestown Dr Unit 323
- 1144 Foxglove Ln Unit 4A
- 650 E Whispering Oaks Ct Unit 2
- 910 E Aster Ave
- 2527 Checker Rd
- 2044 N Ginger Creek Dr Unit 30C
- 175 E Lilly Ln
- 135 E Lilly Ln
- 145 E Lilly Ln
- 150 E Lilly Ln
- 931 E Kings Row Unit 17217
- 931 E Kings Row Unit 17218
- 931 E Kings Row Unit 17216
- 931 E Kings Row Unit 8
- 931 E Kings Row Unit 5
- 937 E Kings Row Unit 17211
- 937 E Kings Row Unit 17213
- 937 E Kings Row Unit 17212
- 937 E Kings Row Unit 17214
- 937 E Kings Row
- 937 E Kings Row Unit 4
- 937 E Kings Row Unit 3
- 937 E Kings Row Unit 211
- 937 E Kings Row Unit 2
- 912 E Kings Row Unit 17135
- 912 E Kings Row Unit 17136
- 912 E Kings Row Unit 17138
- 912 E Kings Row Unit 17137
- 912 E Kings Row Unit 6
- 912 E Kings Row Unit 5