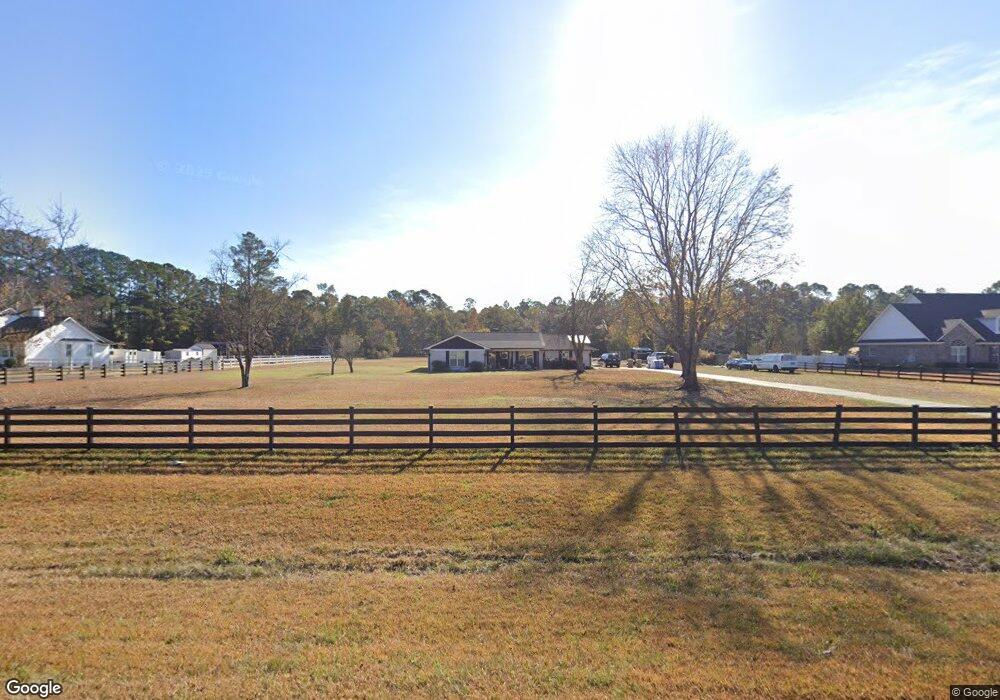
931 Kolic Helmey Rd Guyton, GA 31312
Estimated Value: $443,000 - $460,000
4
Beds
2
Baths
1,815
Sq Ft
$248/Sq Ft
Est. Value
About This Home
This home is located at 931 Kolic Helmey Rd, Guyton, GA 31312 and is currently estimated at $450,476, approximately $248 per square foot. 931 Kolic Helmey Rd is a home located in Effingham County with nearby schools including South Effingham Elementary School, South Effingham Middle School, and South Effingham High School.
Ownership History
Date
Name
Owned For
Owner Type
Purchase Details
Closed on
Mar 9, 2021
Sold by
Sammons David
Bought by
Rinaldi Tonya Sapp and Loper Gregory Frank
Current Estimated Value
Home Financials for this Owner
Home Financials are based on the most recent Mortgage that was taken out on this home.
Original Mortgage
$284,900
Outstanding Balance
$255,522
Interest Rate
2.73%
Mortgage Type
FHA
Estimated Equity
$194,954
Purchase Details
Closed on
Feb 12, 2020
Sold by
Bell Wendi Jo
Bought by
Sammons David
Purchase Details
Closed on
Mar 24, 2006
Sold by
Bell William A
Bought by
Bell Michael A
Home Financials for this Owner
Home Financials are based on the most recent Mortgage that was taken out on this home.
Original Mortgage
$213,600
Interest Rate
6.23%
Mortgage Type
New Conventional
Create a Home Valuation Report for This Property
The Home Valuation Report is an in-depth analysis detailing your home's value as well as a comparison with similar homes in the area
Home Values in the Area
Average Home Value in this Area
Purchase History
| Date | Buyer | Sale Price | Title Company |
|---|---|---|---|
| Rinaldi Tonya Sapp | $295,000 | -- | |
| Sammons David | $261,921 | -- | |
| Bell Wendi Jo | -- | -- | |
| Bell Michael A | $267,000 | -- |
Source: Public Records
Mortgage History
| Date | Status | Borrower | Loan Amount |
|---|---|---|---|
| Open | Rinaldi Tonya Sapp | $284,900 | |
| Previous Owner | Bell Michael A | $213,600 |
Source: Public Records
Tax History Compared to Growth
Tax History
| Year | Tax Paid | Tax Assessment Tax Assessment Total Assessment is a certain percentage of the fair market value that is determined by local assessors to be the total taxable value of land and additions on the property. | Land | Improvement |
|---|---|---|---|---|
| 2024 | $3,866 | $158,250 | $84,170 | $74,080 |
| 2023 | $3,113 | $142,223 | $73,191 | $69,032 |
| 2022 | $3,666 | $118,821 | $55,090 | $63,731 |
| 2021 | $3,366 | $108,567 | $47,085 | $61,482 |
| 2020 | $2,345 | $73,067 | $27,702 | $45,365 |
| 2019 | $2,319 | $71,771 | $26,406 | $45,365 |
| 2018 | $1,974 | $59,209 | $16,734 | $42,475 |
| 2017 | $1,988 | $59,209 | $16,734 | $42,475 |
| 2016 | $1,882 | $58,458 | $16,734 | $41,724 |
| 2015 | -- | $60,738 | $16,734 | $44,004 |
| 2014 | -- | $60,738 | $16,734 | $44,004 |
| 2013 | -- | $60,738 | $16,734 | $44,004 |
Source: Public Records
Map
Nearby Homes
- 137 Scholar Rd
- 105 Homestead Ct
- 108 Settlers Point Dr
- 125 Kensington Cir
- 438 Kessler Loop
- 106 Saddle Ln
- 120 Annie Dr
- 172 Green Paddock Cir
- 103 Brindlewood Dr
- 231 Cypress Creek Ln
- 548 Amsonia Cir
- 276 Caribbean Village Dr
- 275 Caribbean Village Dr
- 144 Tobago Cir
- 217 Cypress Creek Ln
- 193 Saddleclub Way
- 138 Saddleclub Way
- 178 Tobago Cir
- 126 Tobago Cir
- 137 Saddleclub Way
- 949 Kolic Helmey Rd
- 907 Kolic Helmey Rd
- 891 Kolic Helmey Rd
- 971 Kolic Helmey Rd
- 892 Kolic Helmey Rd
- 880 Kolic Helmey Rd
- 855 Kolic Helmey Rd
- 952 Kolic Helmey Rd
- 134 Scholar Rd
- 136 Scholar Rd
- 132 Scholar Rd
- 940 Kolic Helmey Rd
- 856 Kolic Helmey Rd
- 138 Scholar Rd
- 1017 Kolic Helmey Rd
- 1017 Kolic Helmey Rd Unit Parcel B
- 831 Kolic Helmey Rd
- 140 Scholar Rd
- 130 Scholar Rd
- 142 Scholar Rd