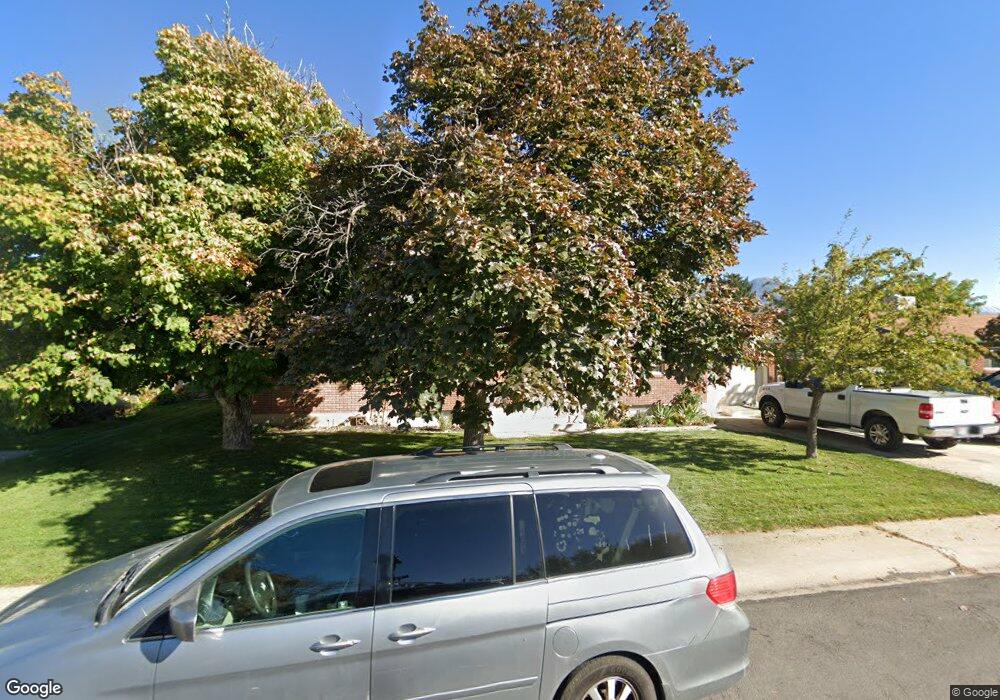
931 S 100 E Orem, UT 84058
Westmore NeighborhoodEstimated Value: $478,000 - $544,000
4
Beds
3
Baths
2,500
Sq Ft
$208/Sq Ft
Est. Value
About This Home
This home is located at 931 S 100 E, Orem, UT 84058 and is currently estimated at $519,139, approximately $207 per square foot. 931 S 100 E is a home located in Utah County with nearby schools including Westmore Elementary School, Lakeridge Jr High School, and Mountain View High School.
Ownership History
Date
Name
Owned For
Owner Type
Purchase Details
Closed on
Jul 16, 2020
Sold by
Bechcker Philip D and Bechcker Sherrie D
Bought by
Sellers Jeremy and Sellers Kartina
Current Estimated Value
Home Financials for this Owner
Home Financials are based on the most recent Mortgage that was taken out on this home.
Original Mortgage
$318,630
Outstanding Balance
$282,540
Interest Rate
3.1%
Mortgage Type
New Conventional
Estimated Equity
$236,599
Purchase Details
Closed on
Oct 3, 2013
Sold by
Nebeker Philip D
Bought by
Nebeker Philip D and Nebeker Sherrie D
Home Financials for this Owner
Home Financials are based on the most recent Mortgage that was taken out on this home.
Original Mortgage
$180,500
Interest Rate
4.57%
Mortgage Type
New Conventional
Purchase Details
Closed on
Feb 10, 1997
Sold by
Hendrix Laura G
Bought by
Hendrix Leland J
Create a Home Valuation Report for This Property
The Home Valuation Report is an in-depth analysis detailing your home's value as well as a comparison with similar homes in the area
Home Values in the Area
Average Home Value in this Area
Purchase History
| Date | Buyer | Sale Price | Title Company |
|---|---|---|---|
| Sellers Jeremy | -- | Investors Title Ins Agcy Inc | |
| Nebeker Philip D | -- | Title West | |
| Nebeker Philip D | -- | Title West | |
| Hendrix Leland J | -- | -- |
Source: Public Records
Mortgage History
| Date | Status | Borrower | Loan Amount |
|---|---|---|---|
| Open | Sellers Jeremy | $318,630 | |
| Previous Owner | Nebeker Philip D | $180,500 |
Source: Public Records
Tax History
| Year | Tax Paid | Tax Assessment Tax Assessment Total Assessment is a certain percentage of the fair market value that is determined by local assessors to be the total taxable value of land and additions on the property. | Land | Improvement |
|---|---|---|---|---|
| 2025 | $2,055 | $266,860 | -- | -- |
| 2024 | $2,055 | $251,240 | $0 | $0 |
| 2023 | $1,891 | $248,545 | $0 | $0 |
| 2022 | $1,908 | $242,880 | $0 | $0 |
| 2021 | $1,774 | $342,100 | $189,800 | $152,300 |
| 2020 | $1,589 | $301,100 | $151,800 | $149,300 |
| 2019 | $1,458 | $287,400 | $140,100 | $147,300 |
| 2018 | $1,353 | $254,800 | $120,600 | $134,200 |
| 2017 | $1,283 | $129,470 | $0 | $0 |
| 2016 | $1,204 | $111,980 | $0 | $0 |
| 2015 | $1,168 | $102,795 | $0 | $0 |
| 2014 | $1,154 | $101,090 | $0 | $0 |
Source: Public Records
Map
Nearby Homes
Your Personal Tour Guide
Ask me questions while you tour the home.