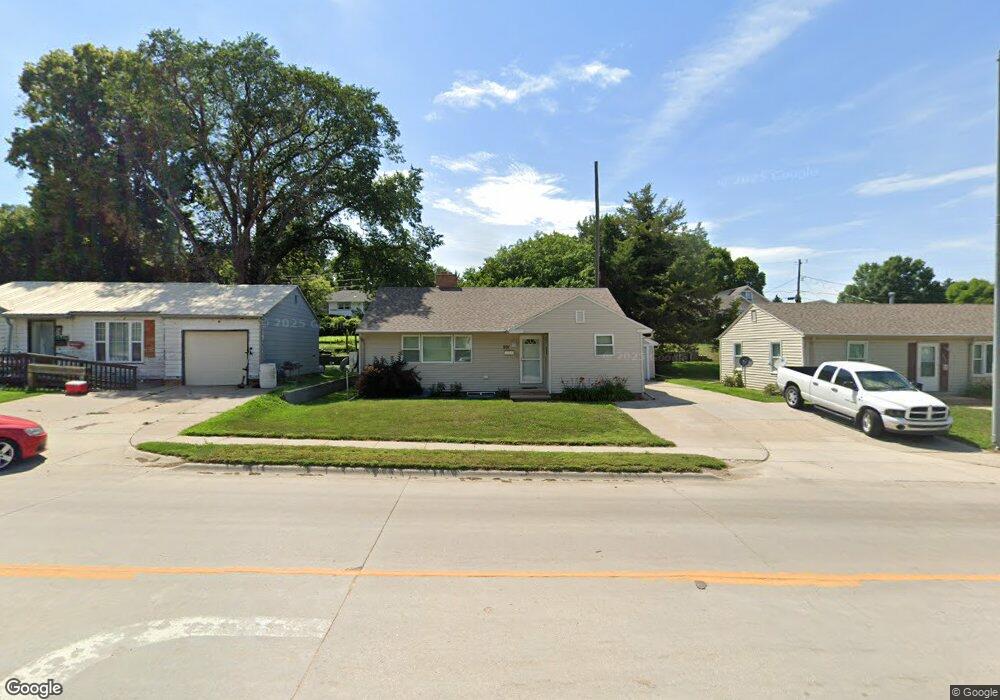
931 S 8th Ave Broken Bow, NE 68822
Estimated Value: $121,000 - $186,000
5
Beds
2
Baths
1,112
Sq Ft
$141/Sq Ft
Est. Value
About This Home
This home is located at 931 S 8th Ave, Broken Bow, NE 68822 and is currently estimated at $156,782, approximately $140 per square foot. 931 S 8th Ave is a home located in Custer County with nearby schools including North Park Elementary School, Broken Bow Junior High School, and Broken Bow High School.
Ownership History
Date
Name
Owned For
Owner Type
Purchase Details
Closed on
Oct 1, 2013
Sold by
Sec Of Housing & Urban Dev
Bought by
Richardson Rentals Llc
Current Estimated Value
Purchase Details
Closed on
Sep 24, 2012
Sold by
Bank Of America Na
Bought by
Secretary Of Housing & Urban Develo
Purchase Details
Closed on
Sep 9, 2005
Sold by
Holloway Kirby L Etal
Bought by
Wells Kirk D and Wells Julie A
Create a Home Valuation Report for This Property
The Home Valuation Report is an in-depth analysis detailing your home's value as well as a comparison with similar homes in the area
Home Values in the Area
Average Home Value in this Area
Purchase History
| Date | Buyer | Sale Price | Title Company |
|---|---|---|---|
| Richardson Rentals Llc | $40,000 | -- | |
| Secretary Of Housing & Urban Develo | $78,300 | -- | |
| Bank Of America Na | $78,300 | -- | |
| Wells Kirk D | $65,600 | -- |
Source: Public Records
Tax History Compared to Growth
Tax History
| Year | Tax Paid | Tax Assessment Tax Assessment Total Assessment is a certain percentage of the fair market value that is determined by local assessors to be the total taxable value of land and additions on the property. | Land | Improvement |
|---|---|---|---|---|
| 2025 | $1,774 | $160,621 | $11,520 | $149,101 |
| 2024 | $1,774 | $129,787 | $11,520 | $118,267 |
| 2023 | $1,866 | $119,109 | $11,520 | $107,589 |
| 2022 | $1,937 | $105,549 | $11,520 | $94,029 |
| 2021 | $1,880 | $104,829 | $10,800 | $94,029 |
| 2020 | $1,864 | $104,829 | $10,800 | $94,029 |
| 2019 | $1,800 | $101,387 | $5,400 | $95,987 |
| 2017 | $1,553 | $85,048 | $5,400 | $79,648 |
| 2016 | $1,662 | $83,176 | $3,528 | $79,648 |
| 2015 | $1,673 | $83,015 | $3,487 | $79,528 |
| 2014 | $1,673 | $75,468 | $3,170 | $72,298 |
Source: Public Records
Map
Nearby Homes