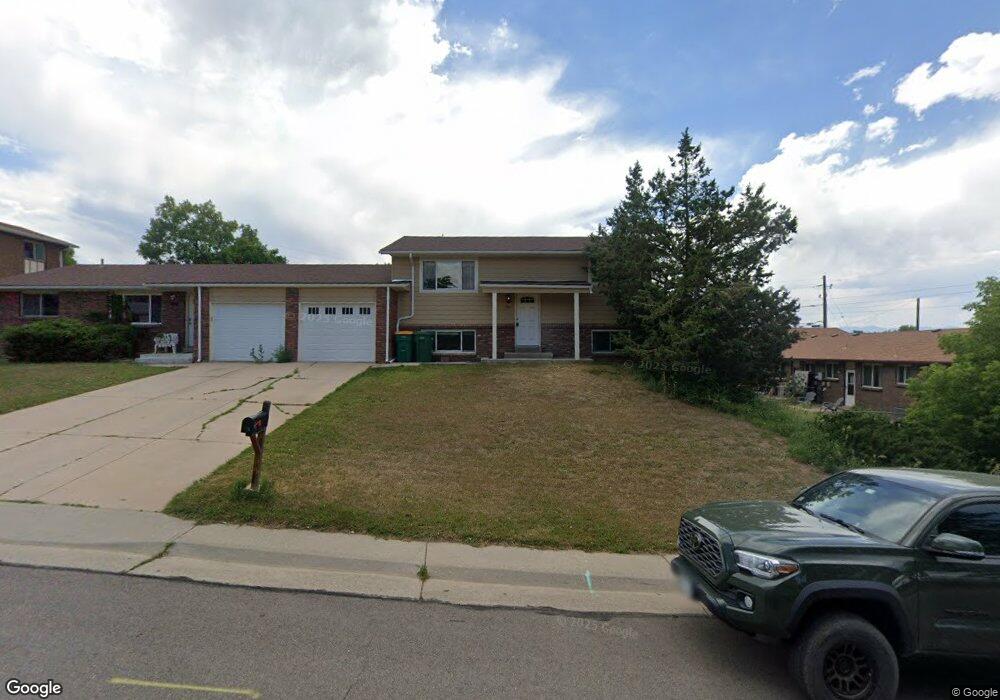
931 S Yarrow St Lakewood, CO 80226
Belmar Park NeighborhoodEstimated Value: $729,000 - $958,000
4
Beds
2
Baths
1,830
Sq Ft
$434/Sq Ft
Est. Value
About This Home
This home is located at 931 S Yarrow St, Lakewood, CO 80226 and is currently estimated at $793,547, approximately $433 per square foot. 931 S Yarrow St is a home located in Jefferson County with nearby schools including Patterson International Elementary School and Alameda International High School.
Ownership History
Date
Name
Owned For
Owner Type
Purchase Details
Closed on
Oct 6, 2022
Sold by
Massive Sfr Llc
Bought by
Signal Sfr Llc
Current Estimated Value
Home Financials for this Owner
Home Financials are based on the most recent Mortgage that was taken out on this home.
Original Mortgage
$955,000
Interest Rate
6.02%
Mortgage Type
Credit Line Revolving
Purchase Details
Closed on
Apr 18, 2022
Sold by
Truitt Andrew R
Bought by
Harvard Sfr Llc
Purchase Details
Closed on
Mar 12, 2014
Sold by
Wegener Douglas H
Bought by
Truitt Andrew R and Truitt Heidi L
Home Financials for this Owner
Home Financials are based on the most recent Mortgage that was taken out on this home.
Original Mortgage
$276,000
Interest Rate
4.36%
Mortgage Type
New Conventional
Purchase Details
Closed on
Sep 15, 1998
Sold by
Rogers Verdel H and Rogers Madonna M
Bought by
Wegener Douglas H
Home Financials for this Owner
Home Financials are based on the most recent Mortgage that was taken out on this home.
Original Mortgage
$163,200
Interest Rate
6.91%
Create a Home Valuation Report for This Property
The Home Valuation Report is an in-depth analysis detailing your home's value as well as a comparison with similar homes in the area
Home Values in the Area
Average Home Value in this Area
Purchase History
| Date | Buyer | Sale Price | Title Company |
|---|---|---|---|
| Signal Sfr Llc | -- | -- | |
| Harvard Sfr Llc | $903,000 | None Listed On Document | |
| Truitt Andrew R | $347,000 | None Available | |
| Wegener Douglas H | $204,000 | -- |
Source: Public Records
Mortgage History
| Date | Status | Borrower | Loan Amount |
|---|---|---|---|
| Previous Owner | Signal Sfr Llc | $955,000 | |
| Previous Owner | Truitt Andrew R | $276,000 | |
| Previous Owner | Wegener Douglas H | $163,200 |
Source: Public Records
Tax History Compared to Growth
Tax History
| Year | Tax Paid | Tax Assessment Tax Assessment Total Assessment is a certain percentage of the fair market value that is determined by local assessors to be the total taxable value of land and additions on the property. | Land | Improvement |
|---|---|---|---|---|
| 2024 | $3,914 | $42,897 | $19,612 | $23,285 |
| 2023 | $3,914 | $42,897 | $19,612 | $23,285 |
| 2022 | $3,156 | $33,757 | $13,977 | $19,780 |
| 2021 | $3,271 | $35,495 | $14,697 | $20,798 |
| 2020 | $3,069 | $33,414 | $14,238 | $19,176 |
| 2019 | $3,030 | $33,414 | $14,238 | $19,176 |
| 2018 | $2,735 | $29,131 | $10,853 | $18,278 |
| 2017 | $2,408 | $29,131 | $10,853 | $18,278 |
| 2016 | $2,439 | $27,500 | $6,852 | $20,648 |
| 2015 | $1,857 | $27,500 | $6,852 | $20,648 |
| 2014 | $1,857 | $19,192 | $6,050 | $13,142 |
Source: Public Records
Map
Nearby Homes
- 902 S Yukon St
- 910 S Wadsworth Blvd
- 1020 S Ammons Cir
- 8255 W Tennessee Ct
- 8230 W Tennessee Ct
- 832 S Vance St Unit F
- 1025 S Butler Way
- 1204 S Balsam Ct
- 5360 W Mississippi Ave
- 640 S Yarrow St
- 1266 S Ammons St
- 7170 W Mississippi Ave
- 1120 S Dover St
- 1257 S Dover Way
- 628 S Carr St
- 888 S Reed Ct Unit B
- 509 S Upham St
- 7240 W Custer Ave Unit 116
- 7240 W Custer Ave Unit 303
- 7240 W Custer Ave Unit 413
- 953 S Yarrow St
- 7806 W Kentucky Ave
- 951 S Yarrow St
- 912 S Zephyr Ct
- 7876 W Kentucky Ave
- 902 S Zephyr Ct Unit 902
- 920 S Yarrow St
- 922 S Zephyr Ct
- 973 S Yarrow St
- 971 S Yarrow St
- 900 S Yarrow St
- 940 S Yarrow St
- 942 S Zephyr Ct
- 950 S Yarrow St
- 991 S Yarrow St
- 953 S Zephyr Ct
- 962 S Zephyr Ct
- 905 S Yukon St
- 923 S Zephyr Ct
- 909 S Yukon St