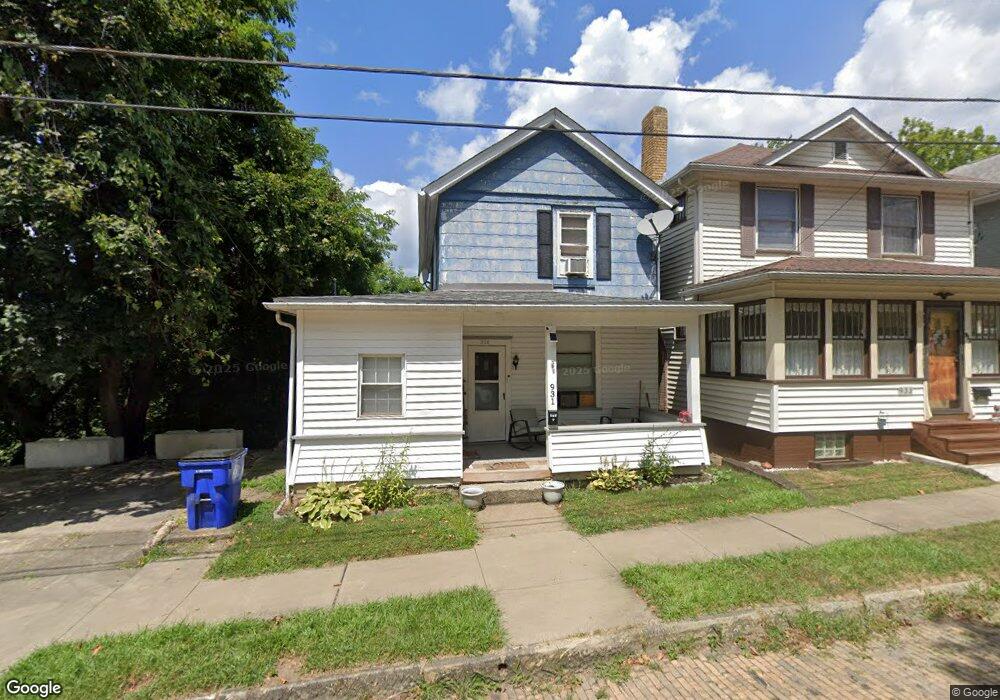
931 Vine St East Liverpool, OH 43920
Estimated Value: $43,000 - $81,000
2
Beds
2
Baths
1,304
Sq Ft
$53/Sq Ft
Est. Value
About This Home
This home is located at 931 Vine St, East Liverpool, OH 43920 and is currently estimated at $68,901, approximately $52 per square foot. 931 Vine St is a home located in Columbiana County with nearby schools including Westgate Middle School, North Elementary School, and East Liverpool High School.
Ownership History
Date
Name
Owned For
Owner Type
Purchase Details
Closed on
Jun 8, 2023
Sold by
Adams Mariah
Bought by
Miller Mariah M
Current Estimated Value
Purchase Details
Closed on
Feb 10, 2022
Sold by
Alan E Barnes Rentals Llc
Bought by
Adams Mariah
Purchase Details
Closed on
Oct 16, 2018
Sold by
Barnes Alan E and Barnes Terry L
Bought by
Alan E Barnes Rentals Llc
Purchase Details
Closed on
Dec 28, 2016
Sold by
Manypenny Delores A
Bought by
Barnes Alan E and Barnes Terry L
Purchase Details
Closed on
Oct 27, 2016
Sold by
Manypenny Richard M
Bought by
Manypenny Delores A and Manypenny Richard M
Purchase Details
Closed on
Dec 23, 1994
Sold by
Maple Jay
Bought by
Manypenny Richard M and Manypenny Delores A
Home Financials for this Owner
Home Financials are based on the most recent Mortgage that was taken out on this home.
Original Mortgage
$31,390
Interest Rate
9.19%
Mortgage Type
FHA
Purchase Details
Closed on
May 4, 1992
Bought by
Manypenny Richard M and Manypenny Or
Create a Home Valuation Report for This Property
The Home Valuation Report is an in-depth analysis detailing your home's value as well as a comparison with similar homes in the area
Home Values in the Area
Average Home Value in this Area
Purchase History
| Date | Buyer | Sale Price | Title Company |
|---|---|---|---|
| Miller Mariah M | -- | None Listed On Document | |
| Adams Mariah | $18,500 | None Listed On Document | |
| Alan E Barnes Rentals Llc | -- | -- | |
| Barnes Alan E | -- | None Available | |
| Manypenny Delores A | -- | Attorney | |
| Manypenny Richard M | $29,900 | -- | |
| Manypenny Richard M | $7,500 | -- |
Source: Public Records
Mortgage History
| Date | Status | Borrower | Loan Amount |
|---|---|---|---|
| Previous Owner | Manypenny Richard M | $31,390 |
Source: Public Records
Tax History Compared to Growth
Tax History
| Year | Tax Paid | Tax Assessment Tax Assessment Total Assessment is a certain percentage of the fair market value that is determined by local assessors to be the total taxable value of land and additions on the property. | Land | Improvement |
|---|---|---|---|---|
| 2024 | $548 | $13,340 | $420 | $12,920 |
| 2023 | $548 | $13,340 | $420 | $12,920 |
| 2022 | $563 | $13,340 | $420 | $12,920 |
| 2021 | $490 | $10,650 | $390 | $10,260 |
| 2020 | $491 | $10,650 | $390 | $10,260 |
| 2019 | $478 | $10,650 | $390 | $10,260 |
| 2018 | $462 | $9,660 | $350 | $9,310 |
| 2017 | $486 | $9,660 | $350 | $9,310 |
| 2016 | $33 | $9,420 | $350 | $9,070 |
| 2015 | $33 | $9,420 | $350 | $9,070 |
| 2014 | $32 | $9,420 | $350 | $9,070 |
Source: Public Records
Map
Nearby Homes