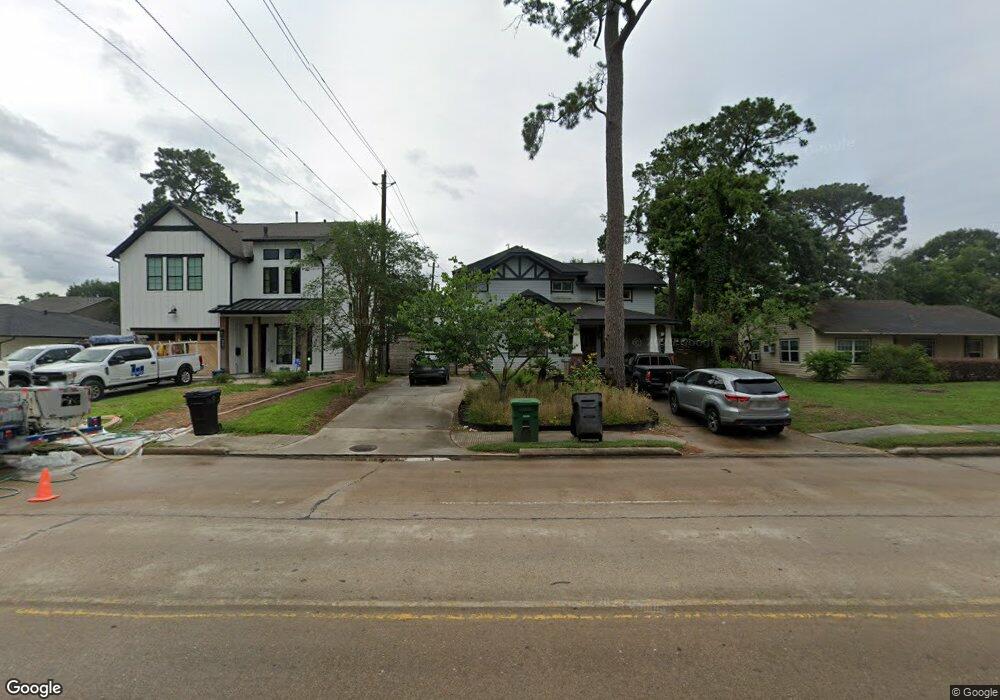
931 W 43rd St Houston, TX 77018
Oak Forest-Garden Oaks NeighborhoodEstimated Value: $434,000 - $1,021,000
3
Beds
2
Baths
3,226
Sq Ft
$233/Sq Ft
Est. Value
About This Home
This home is located at 931 W 43rd St, Houston, TX 77018 and is currently estimated at $752,260, approximately $233 per square foot. 931 W 43rd St is a home located in Harris County with nearby schools including Garden Oaks Montessori, Frank Black Middle School, and Waltrip High School.
Ownership History
Date
Name
Owned For
Owner Type
Purchase Details
Closed on
Dec 31, 2004
Sold by
Seiler Rodney J and Hlanak Linhard E
Bought by
Rahman Siddiqur and Rahman Gomini
Current Estimated Value
Home Financials for this Owner
Home Financials are based on the most recent Mortgage that was taken out on this home.
Original Mortgage
$131,950
Outstanding Balance
$66,575
Interest Rate
5.74%
Mortgage Type
Purchase Money Mortgage
Estimated Equity
$685,685
Purchase Details
Closed on
Dec 3, 1998
Sold by
Robinson Linda Bullard
Bought by
Seiler Rodney J and Hlanak Linhard E
Home Financials for this Owner
Home Financials are based on the most recent Mortgage that was taken out on this home.
Original Mortgage
$59,400
Interest Rate
6.69%
Purchase Details
Closed on
Jul 15, 1998
Sold by
Bullard John L and Bullard William
Bought by
Robinson Linda Bullard
Create a Home Valuation Report for This Property
The Home Valuation Report is an in-depth analysis detailing your home's value as well as a comparison with similar homes in the area
Home Values in the Area
Average Home Value in this Area
Purchase History
| Date | Buyer | Sale Price | Title Company |
|---|---|---|---|
| Rahman Siddiqur | -- | Texas American Title Company | |
| Seiler Rodney J | -- | Regency Title | |
| Robinson Linda Bullard | -- | -- |
Source: Public Records
Mortgage History
| Date | Status | Borrower | Loan Amount |
|---|---|---|---|
| Open | Rahman Siddiqur | $131,950 | |
| Previous Owner | Seiler Rodney J | $59,400 |
Source: Public Records
Tax History Compared to Growth
Tax History
| Year | Tax Paid | Tax Assessment Tax Assessment Total Assessment is a certain percentage of the fair market value that is determined by local assessors to be the total taxable value of land and additions on the property. | Land | Improvement |
|---|---|---|---|---|
| 2025 | $12,881 | $849,366 | $384,750 | $464,616 |
| 2024 | $12,881 | $820,000 | $352,688 | $467,312 |
| 2023 | $12,881 | $821,309 | $333,450 | $487,859 |
| 2022 | $14,964 | $710,869 | $333,450 | $377,419 |
| 2021 | $13,483 | $578,524 | $307,800 | $270,724 |
| 2020 | $14,543 | $600,572 | $269,325 | $331,247 |
| 2019 | $14,537 | $574,476 | $269,325 | $305,151 |
| 2018 | $11,762 | $593,000 | $323,190 | $269,810 |
| 2017 | $15,381 | $608,300 | $323,190 | $285,110 |
| 2016 | $15,549 | $636,812 | $323,190 | $313,622 |
| 2015 | $11,146 | $559,021 | $269,325 | $289,696 |
| 2014 | $11,146 | $547,847 | $230,850 | $316,997 |
Source: Public Records
Map
Nearby Homes
- 934 W 43rd St
- 903 W 43rd St
- 938 Gardenia Dr
- 979 W 43rd St
- 830 Azalea St
- 1018 Lamonte Ln
- 1014 Gardenia Dr
- 959 Althea Dr
- 991 Curtin St
- 814 Azalea St
- 1067 Curtin St
- 1020 W 42nd St
- 963 W 41st St
- 1547 Sue Barnett Dr
- 1046 Gardenia Dr
- 1550 Sue Barnett Dr
- 909 Fisher St
- 1062 Lamonte Ln
- 834 W 41st St
- 925 Fisher St Unit D