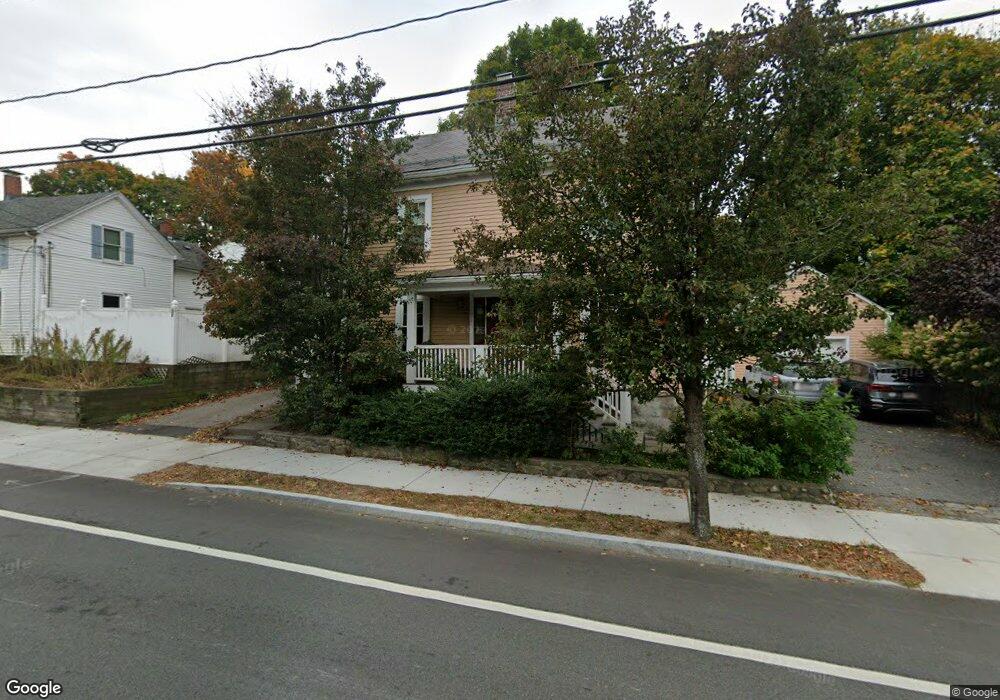
931 Walnut St Newton Highlands, MA 02461
Newton Highlands NeighborhoodEstimated Value: $1,208,116 - $1,426,000
3
Beds
2
Baths
1,464
Sq Ft
$899/Sq Ft
Est. Value
About This Home
This home is located at 931 Walnut St, Newton Highlands, MA 02461 and is currently estimated at $1,316,279, approximately $899 per square foot. 931 Walnut St is a home located in Middlesex County with nearby schools including Zervas Elementary School, Oak Hill Middle School, and Newton South High School.
Ownership History
Date
Name
Owned For
Owner Type
Purchase Details
Closed on
Jun 25, 2010
Sold by
Saarony Gad M
Bought by
Thorp John M and Thorp Erica L
Current Estimated Value
Home Financials for this Owner
Home Financials are based on the most recent Mortgage that was taken out on this home.
Original Mortgage
$468,000
Interest Rate
4.98%
Mortgage Type
Purchase Money Mortgage
Purchase Details
Closed on
Jan 11, 2005
Sold by
Robinson Jane C
Bought by
Sarony Gad M
Home Financials for this Owner
Home Financials are based on the most recent Mortgage that was taken out on this home.
Original Mortgage
$359,600
Interest Rate
5.75%
Mortgage Type
Purchase Money Mortgage
Purchase Details
Closed on
Jun 12, 1996
Sold by
Fairhurst Marjorie H
Bought by
Robinson Jane C
Home Financials for this Owner
Home Financials are based on the most recent Mortgage that was taken out on this home.
Original Mortgage
$167,200
Interest Rate
7.97%
Mortgage Type
Purchase Money Mortgage
Create a Home Valuation Report for This Property
The Home Valuation Report is an in-depth analysis detailing your home's value as well as a comparison with similar homes in the area
Home Values in the Area
Average Home Value in this Area
Purchase History
| Date | Buyer | Sale Price | Title Company |
|---|---|---|---|
| Thorp John M | $585,000 | -- | |
| Sarony Gad M | $450,000 | -- | |
| Robinson Jane C | $209,000 | -- |
Source: Public Records
Mortgage History
| Date | Status | Borrower | Loan Amount |
|---|---|---|---|
| Open | Robinson Jane C | $468,000 | |
| Closed | Thorp John M | $468,000 | |
| Previous Owner | Sarony Gad M | $359,600 | |
| Previous Owner | Robinson Jane C | $188,500 | |
| Previous Owner | Robinson Jane C | $167,200 |
Source: Public Records
Tax History Compared to Growth
Tax History
| Year | Tax Paid | Tax Assessment Tax Assessment Total Assessment is a certain percentage of the fair market value that is determined by local assessors to be the total taxable value of land and additions on the property. | Land | Improvement |
|---|---|---|---|---|
| 2025 | $9,751 | $995,000 | $783,200 | $211,800 |
| 2024 | $9,428 | $966,000 | $760,400 | $205,600 |
| 2023 | $8,883 | $872,600 | $568,700 | $303,900 |
| 2022 | $8,500 | $808,000 | $526,600 | $281,400 |
| 2021 | $8,202 | $762,300 | $496,800 | $265,500 |
| 2020 | $7,958 | $762,300 | $496,800 | $265,500 |
| 2019 | $7,734 | $740,100 | $482,300 | $257,800 |
| 2018 | $7,316 | $676,200 | $436,200 | $240,000 |
| 2017 | $7,093 | $637,900 | $411,500 | $226,400 |
| 2016 | $6,785 | $596,200 | $384,600 | $211,600 |
| 2015 | $6,469 | $557,200 | $359,400 | $197,800 |
Source: Public Records
Map
Nearby Homes
- 956 Walnut St Unit 4
- 956 Walnut St Unit 7
- 956 Walnut St Unit 6
- 28 Wilson Cir Unit 28
- 32 Wilson Cir Unit 32
- 26 Wilson Cir Unit 26
- 1114 Beacon St Unit 106
- 1114 Beacon St Unit 203
- 1114 Beacon St Unit 111
- 1114 Beacon St Unit 104
- 1114 Beacon St Unit 207
- 54 Garland Rd
- 2 Raeburn Terrace
- 59 Charlotte Rd
- Lot 3 Chapin Rd
- Lot 2 Chapin Rd
- Lots 2 & 3 Chapin Rd
- 1151 Walnut St Unit 205
- 1151 Walnut St Unit 405
- 1151 Walnut St Unit 207
- 923 Walnut St
- 925 Walnut St
- 935 Walnut St
- 935 Walnut St Unit 935
- 4 Carthay Cir
- 919 Walnut St
- 936 Walnut St Unit 934
- 936 Walnut St
- 936 Walnut St Unit 936
- 936 Walnut St Unit 936 936
- 930 Walnut St Unit 932
- 941 Walnut St
- 0 Carthay Cir Unit 1
- 0 Carthay Cir
- 940 Walnut St
- 6 Carthay Cir
- 926 Walnut St
- 926 Walnut St
- 926 Walnut St Unit 926
- 926 Walnut St Unit 1