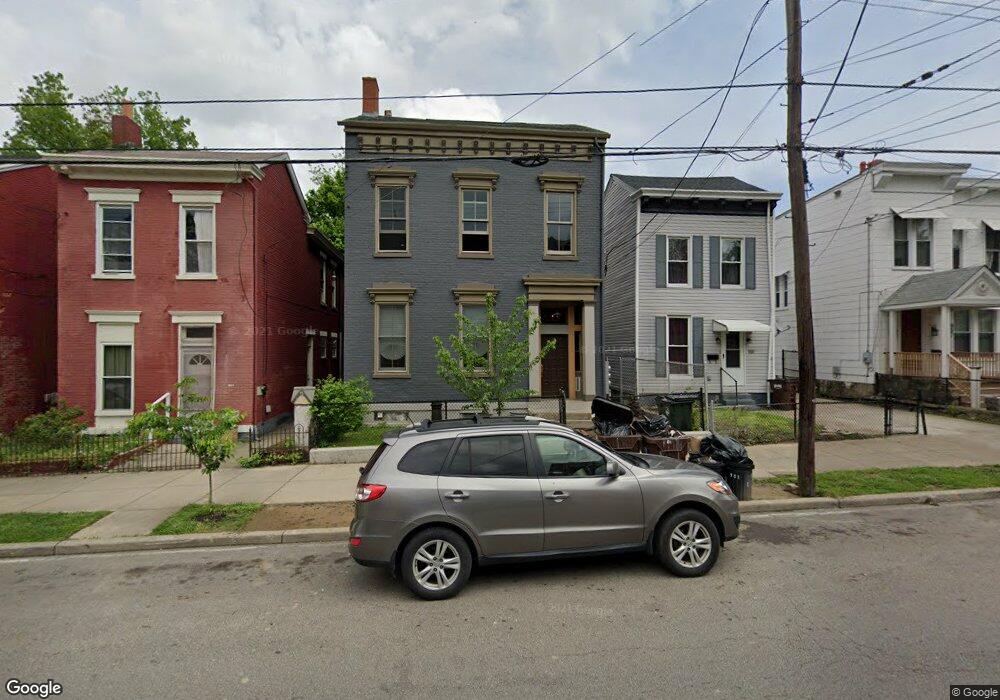
931 York St Unit 1 Newport, KY 41071
Estimated Value: $369,000 - $507,000
4
Beds
3
Baths
2,624
Sq Ft
$178/Sq Ft
Est. Value
About This Home
This home is located at 931 York St Unit 1, Newport, KY 41071 and is currently estimated at $466,458, approximately $177 per square foot. 931 York St Unit 1 is a home located in Campbell County with nearby schools including Newport Primary School, Newport Intermediate School, and Newport High School.
Ownership History
Date
Name
Owned For
Owner Type
Purchase Details
Closed on
Mar 13, 2020
Sold by
Bosley Bonnie
Bought by
Tweel Chase A
Current Estimated Value
Home Financials for this Owner
Home Financials are based on the most recent Mortgage that was taken out on this home.
Original Mortgage
$342,187
Outstanding Balance
$302,478
Interest Rate
3.4%
Mortgage Type
FHA
Estimated Equity
$163,980
Purchase Details
Closed on
Apr 30, 2018
Sold by
Hofmann Arthur J and Hofmann Carolyn J
Bought by
Bosley Bonnie
Create a Home Valuation Report for This Property
The Home Valuation Report is an in-depth analysis detailing your home's value as well as a comparison with similar homes in the area
Home Values in the Area
Average Home Value in this Area
Purchase History
| Date | Buyer | Sale Price | Title Company |
|---|---|---|---|
| Tweel Chase A | $348,500 | Kentucky Land Title Agcy Inc | |
| Bosley Bonnie | $94,000 | Springdale Title Llc |
Source: Public Records
Mortgage History
| Date | Status | Borrower | Loan Amount |
|---|---|---|---|
| Open | Tweel Chase A | $342,187 |
Source: Public Records
Tax History Compared to Growth
Tax History
| Year | Tax Paid | Tax Assessment Tax Assessment Total Assessment is a certain percentage of the fair market value that is determined by local assessors to be the total taxable value of land and additions on the property. | Land | Improvement |
|---|---|---|---|---|
| 2024 | $1,581 | $410,600 | $25,000 | $385,600 |
| 2023 | $1,377 | $348,500 | $10,000 | $338,500 |
| 2022 | $1,523 | $348,500 | $10,000 | $338,500 |
| 2021 | $1,564 | $348,500 | $10,000 | $338,500 |
| 2020 | $1,390 | $299,800 | $10,000 | $289,800 |
| 2019 | $725 | $139,000 | $4,500 | $134,500 |
| 2018 | $434 | $71,000 | $4,500 | $66,500 |
| 2017 | $436 | $71,000 | $4,500 | $66,500 |
| 2016 | $382 | $71,000 | $0 | $0 |
| 2015 | $318 | $54,500 | $0 | $0 |
| 2014 | $313 | $54,500 | $0 | $0 |
Source: Public Records
Map
Nearby Homes