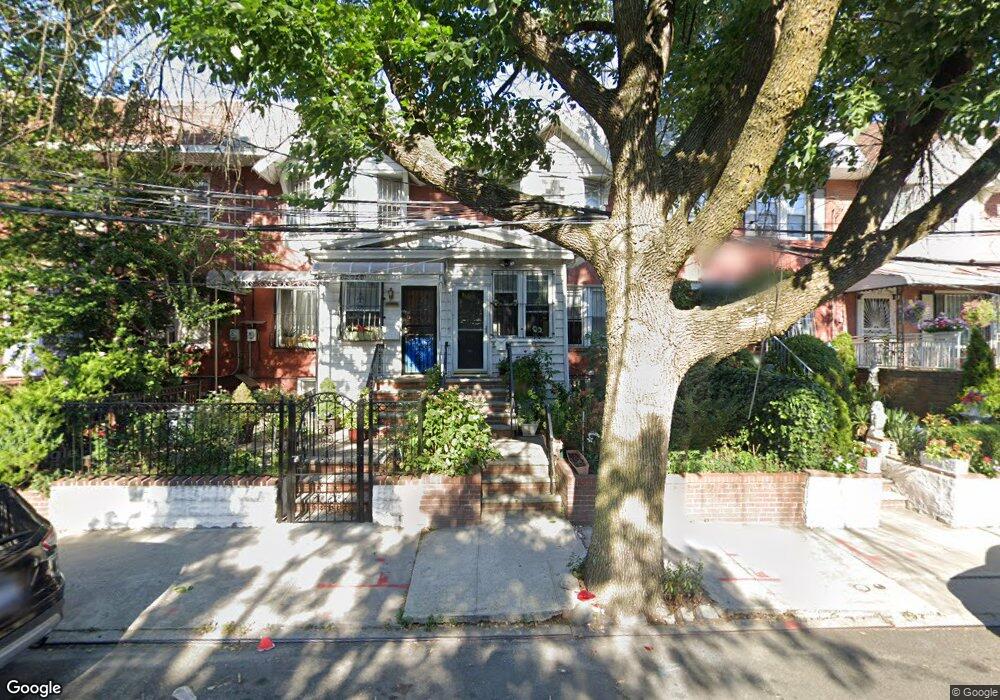
9311 95th St Woodhaven, NY 11421
Woodhaven NeighborhoodEstimated Value: $686,053 - $806,000
--
Bed
--
Bath
1,322
Sq Ft
$570/Sq Ft
Est. Value
About This Home
This home is located at 9311 95th St, Woodhaven, NY 11421 and is currently estimated at $753,513, approximately $569 per square foot. 9311 95th St is a home located in Queens County with nearby schools including P.S. 273, Jhs 210 Elizabeth Blackwell, and Richmond Hill High School.
Ownership History
Date
Name
Owned For
Owner Type
Purchase Details
Closed on
Sep 30, 2009
Sold by
Chuva Manuel and Decastro Juana
Bought by
Chuva Maniuel
Current Estimated Value
Purchase Details
Closed on
Sep 14, 2001
Sold by
Taub Tito Bernard
Bought by
Chuva Manuel and Decastro Juana
Home Financials for this Owner
Home Financials are based on the most recent Mortgage that was taken out on this home.
Original Mortgage
$231,350
Interest Rate
6.7%
Purchase Details
Closed on
May 16, 2001
Sold by
Desio Josephine and Gandolfo Nancy
Bought by
Taub Tito Bernard
Create a Home Valuation Report for This Property
The Home Valuation Report is an in-depth analysis detailing your home's value as well as a comparison with similar homes in the area
Home Values in the Area
Average Home Value in this Area
Purchase History
| Date | Buyer | Sale Price | Title Company |
|---|---|---|---|
| Chuva Maniuel | -- | -- | |
| Chuva Maniuel | -- | -- | |
| Chuva Manuel | -- | -- | |
| Chuva Manuel | -- | -- | |
| Taub Tito Bernard | -- | -- | |
| Taub Tito Bernard | -- | -- |
Source: Public Records
Mortgage History
| Date | Status | Borrower | Loan Amount |
|---|---|---|---|
| Previous Owner | Chuva Manuel | $231,350 |
Source: Public Records
Tax History Compared to Growth
Tax History
| Year | Tax Paid | Tax Assessment Tax Assessment Total Assessment is a certain percentage of the fair market value that is determined by local assessors to be the total taxable value of land and additions on the property. | Land | Improvement |
|---|---|---|---|---|
| 2025 | $5,376 | $29,856 | $7,164 | $22,692 |
| 2024 | $5,388 | $28,166 | $7,439 | $20,727 |
| 2023 | $5,376 | $28,166 | $7,338 | $20,828 |
| 2022 | $5,161 | $38,460 | $10,380 | $28,080 |
| 2021 | $5,122 | $39,000 | $10,380 | $28,620 |
| 2020 | $3,875 | $36,120 | $10,380 | $25,740 |
| 2019 | $4,613 | $36,060 | $10,380 | $25,680 |
| 2018 | $4,487 | $23,472 | $7,238 | $16,234 |
| 2017 | $4,336 | $22,742 | $8,196 | $14,546 |
| 2016 | $3,979 | $22,742 | $8,196 | $14,546 |
| 2015 | $2,368 | $20,733 | $10,906 | $9,827 |
| 2014 | $2,368 | $19,560 | $11,520 | $8,040 |
Source: Public Records
Map
Nearby Homes