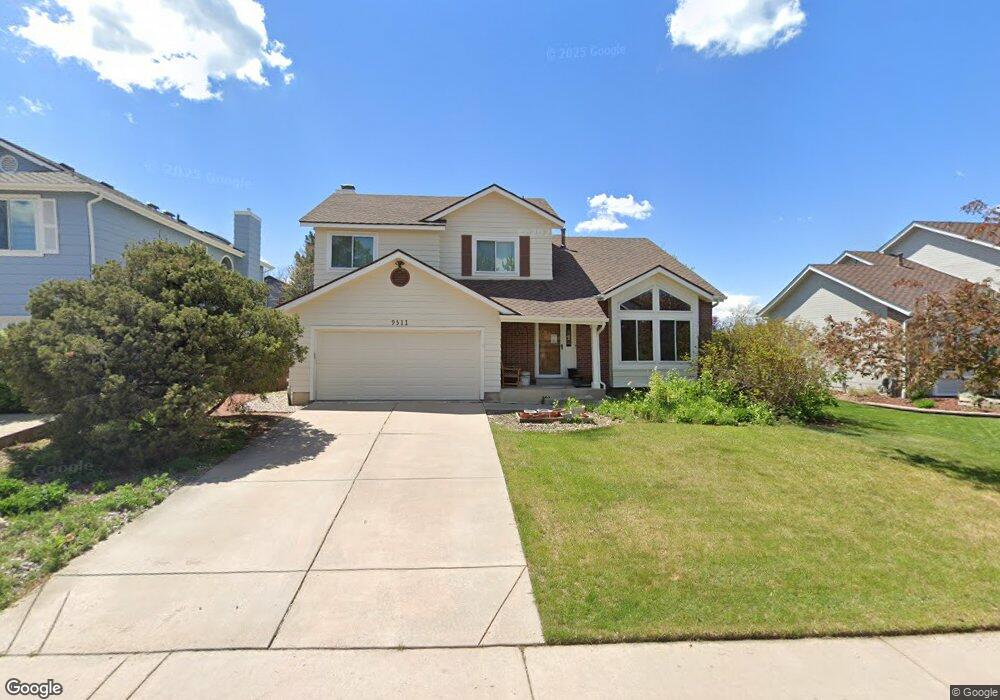
9311 Crestmore Way Highlands Ranch, CO 80126
Northridge NeighborhoodEstimated Value: $658,227 - $694,000
3
Beds
3
Baths
1,784
Sq Ft
$379/Sq Ft
Est. Value
About This Home
This home is located at 9311 Crestmore Way, Highlands Ranch, CO 80126 and is currently estimated at $676,807, approximately $379 per square foot. 9311 Crestmore Way is a home located in Douglas County with nearby schools including Northridge Elementary School, Mountain Ridge Middle School, and Mountain Vista High School.
Ownership History
Date
Name
Owned For
Owner Type
Purchase Details
Closed on
Feb 20, 2007
Sold by
Jechura John L
Bought by
Jechura John L and Jechura Janet Lisa Whittom
Current Estimated Value
Home Financials for this Owner
Home Financials are based on the most recent Mortgage that was taken out on this home.
Original Mortgage
$244,000
Outstanding Balance
$146,551
Interest Rate
6.21%
Mortgage Type
New Conventional
Estimated Equity
$530,256
Purchase Details
Closed on
Nov 14, 2002
Sold by
Jechura John L and Jechura Sally K
Bought by
Jechura John L
Home Financials for this Owner
Home Financials are based on the most recent Mortgage that was taken out on this home.
Original Mortgage
$206,250
Interest Rate
4.62%
Purchase Details
Closed on
Apr 23, 1986
Sold by
Mission Viejo Co
Bought by
Jechura John L and Jechura Sally K
Create a Home Valuation Report for This Property
The Home Valuation Report is an in-depth analysis detailing your home's value as well as a comparison with similar homes in the area
Home Values in the Area
Average Home Value in this Area
Purchase History
| Date | Buyer | Sale Price | Title Company |
|---|---|---|---|
| Jechura John L | -- | Security Title | |
| Jechura John L | -- | Land Title | |
| Jechura John L | $132,300 | -- |
Source: Public Records
Mortgage History
| Date | Status | Borrower | Loan Amount |
|---|---|---|---|
| Open | Jechura John L | $244,000 | |
| Closed | Jechura John L | $206,250 |
Source: Public Records
Tax History Compared to Growth
Tax History
| Year | Tax Paid | Tax Assessment Tax Assessment Total Assessment is a certain percentage of the fair market value that is determined by local assessors to be the total taxable value of land and additions on the property. | Land | Improvement |
|---|---|---|---|---|
| 2024 | $3,159 | $43,900 | $11,550 | $32,350 |
| 2023 | $3,784 | $43,900 | $11,550 | $32,350 |
| 2022 | $2,850 | $31,200 | $7,810 | $23,390 |
| 2021 | $2,965 | $31,200 | $7,810 | $23,390 |
| 2020 | $2,808 | $30,280 | $7,520 | $22,760 |
| 2019 | $2,819 | $30,280 | $7,520 | $22,760 |
| 2018 | $2,441 | $25,830 | $6,520 | $19,310 |
| 2017 | $2,223 | $25,830 | $6,520 | $19,310 |
| 2016 | $2,092 | $23,860 | $6,820 | $17,040 |
| 2015 | $2,137 | $23,860 | $6,820 | $17,040 |
| 2014 | $1,775 | $18,300 | $4,340 | $13,960 |
Source: Public Records
Map
Nearby Homes
- 9361 Crestmore Way
- 1146 Cherry Blossom Ct
- 996 Cherry Blossom Ct
- 867 Summer Dr Unit 9C
- 842 Summer Dr Unit 3E
- 9191 Hickory Cir
- 669 Walden Ct
- 745 Stowe St
- 9151 Weatherstone Ct
- 9492 Joyce Ln
- 9510 Joyce Ln
- 9170 Stargrass Cir
- 2105 Weatherstone Cir
- 2226 Thistle Ridge Cir
- 495 Ridgeglen Way
- 9603 Chesapeake St
- 9409 Prairie View Dr
- 8837 Cactus Flower Way
- 2249 Weatherstone Cir
- 540 Snowy Owl Place
- 9311 S Crestmore Way
- 9301 Crestmore Way
- 9321 Crestmore Way
- 9326 Pepperwood Ln
- 9336 Pepperwood Ln
- 9331 Crestmore Way
- 9291 Crestmore Way
- 9316 Pepperwood Ln
- 9346 Pepperwood Ln
- 9312 Crestmore Way
- 9302 Crestmore Way
- 9281 Crestmore Way
- 9306 Pepperwood Ln
- 9341 Crestmore Way
- 9322 Crestmore Way
- 9356 Pepperwood Ln
- 9292 Crestmore Way
- 9282 Crestmore Way
- 9342 Crestmore Way
- 9366 Pepperwood Ln