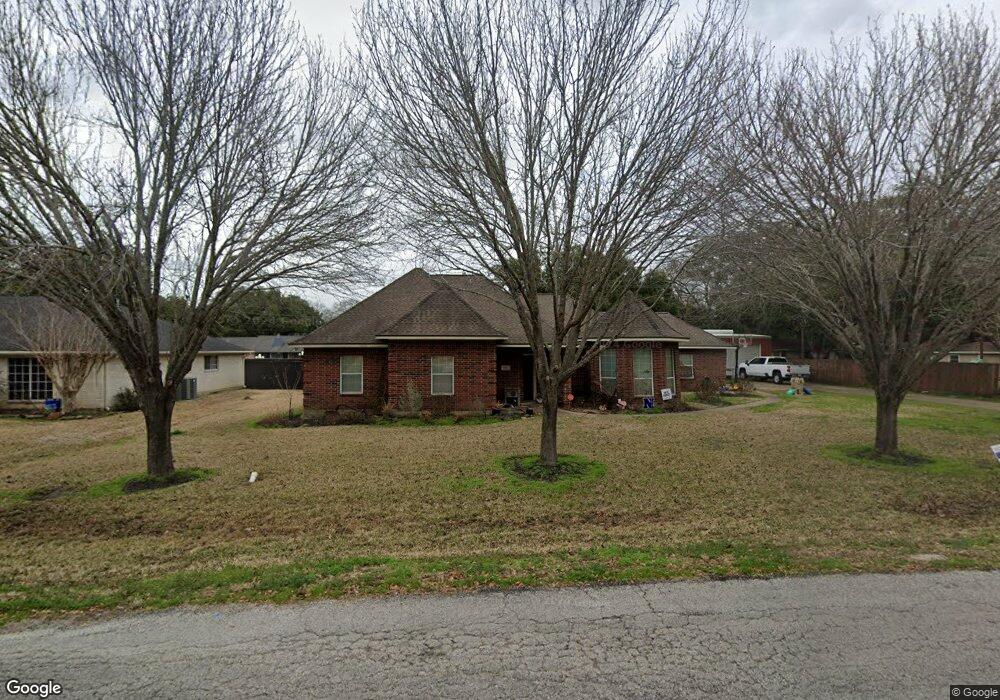
9311 Gene St Needville, TX 77461
Estimated Value: $376,000 - $572,000
4
Beds
2
Baths
2,011
Sq Ft
$217/Sq Ft
Est. Value
About This Home
This home is located at 9311 Gene St, Needville, TX 77461 and is currently estimated at $435,974, approximately $216 per square foot. 9311 Gene St is a home located in Fort Bend County with nearby schools including Needville Elementary School, Needville Junior High School, and Needville Middle School.
Ownership History
Date
Name
Owned For
Owner Type
Purchase Details
Closed on
Aug 9, 2013
Sold by
Bryson Ann Petrosky and Krejci Wanda Gale Petrosky
Bought by
Sbrusch Wyatt J and Sbrusch Kyla B
Current Estimated Value
Home Financials for this Owner
Home Financials are based on the most recent Mortgage that was taken out on this home.
Original Mortgage
$200,450
Outstanding Balance
$149,897
Interest Rate
4.53%
Mortgage Type
New Conventional
Estimated Equity
$286,077
Purchase Details
Closed on
May 14, 2013
Sold by
Petrosky Edmond and Petrosky Helen
Bought by
Sbrusch Wyatt J and Sbrusch Kyla B
Purchase Details
Closed on
Jul 12, 2002
Sold by
Poncik Eugene E
Bought by
Petrosky Edmond and Petrosky Helen
Home Financials for this Owner
Home Financials are based on the most recent Mortgage that was taken out on this home.
Original Mortgage
$74,000
Interest Rate
6.73%
Create a Home Valuation Report for This Property
The Home Valuation Report is an in-depth analysis detailing your home's value as well as a comparison with similar homes in the area
Home Values in the Area
Average Home Value in this Area
Purchase History
| Date | Buyer | Sale Price | Title Company |
|---|---|---|---|
| Sbrusch Wyatt J | -- | Startex Title Co | |
| Sbrusch Wyatt J | -- | -- | |
| Sbrusch Wyatt J | -- | -- | |
| Petrosky Edmond | -- | American Title Co |
Source: Public Records
Mortgage History
| Date | Status | Borrower | Loan Amount |
|---|---|---|---|
| Open | Sbrusch Wyatt J | $200,450 | |
| Closed | Sbrusch Wyatt J | $200,450 | |
| Previous Owner | Petrosky Edmond | $74,000 |
Source: Public Records
Tax History Compared to Growth
Tax History
| Year | Tax Paid | Tax Assessment Tax Assessment Total Assessment is a certain percentage of the fair market value that is determined by local assessors to be the total taxable value of land and additions on the property. | Land | Improvement |
|---|---|---|---|---|
| 2025 | $7,945 | $450,943 | $56,057 | $448,380 |
| 2024 | $7,945 | $409,948 | -- | $421,283 |
| 2023 | $6,955 | $372,680 | $0 | $431,479 |
| 2022 | $7,080 | $338,800 | $0 | $380,880 |
| 2021 | $6,944 | $308,000 | $56,060 | $251,940 |
| 2020 | $6,664 | $280,000 | $56,060 | $223,940 |
| 2019 | $6,781 | $264,340 | $54,690 | $209,650 |
| 2018 | $6,109 | $240,310 | $29,400 | $210,910 |
| 2017 | $5,573 | $218,460 | $29,400 | $189,060 |
| 2016 | $5,579 | $218,710 | $29,400 | $189,310 |
| 2015 | $5,102 | $222,190 | $29,400 | $192,790 |
| 2014 | $5,247 | $219,840 | $29,400 | $190,440 |
Source: Public Records
Map
Nearby Homes
- 3339 Terry St
- 3118 Violet St
- 3803 Doveswood Cir
- 0 Farm To Market Road 1236
- 14120 Farm To Market Road 1236
- 9206 Kostelnik St
- 10010 Texas 36
- 3814 Doveswood Cir
- 14210 Hay Meadow Ln
- 3811 Candlewood Cir
- 000 Tolbert St
- 00 Tolbert St
- 3003 Violet St
- 3818 Founders Dr
- 3002 Caroline St
- 14210 Cally Cir
- 13911 W Richmond St
- 2811 School St
- 3819 Willow Breeze
- 8911 Charity St