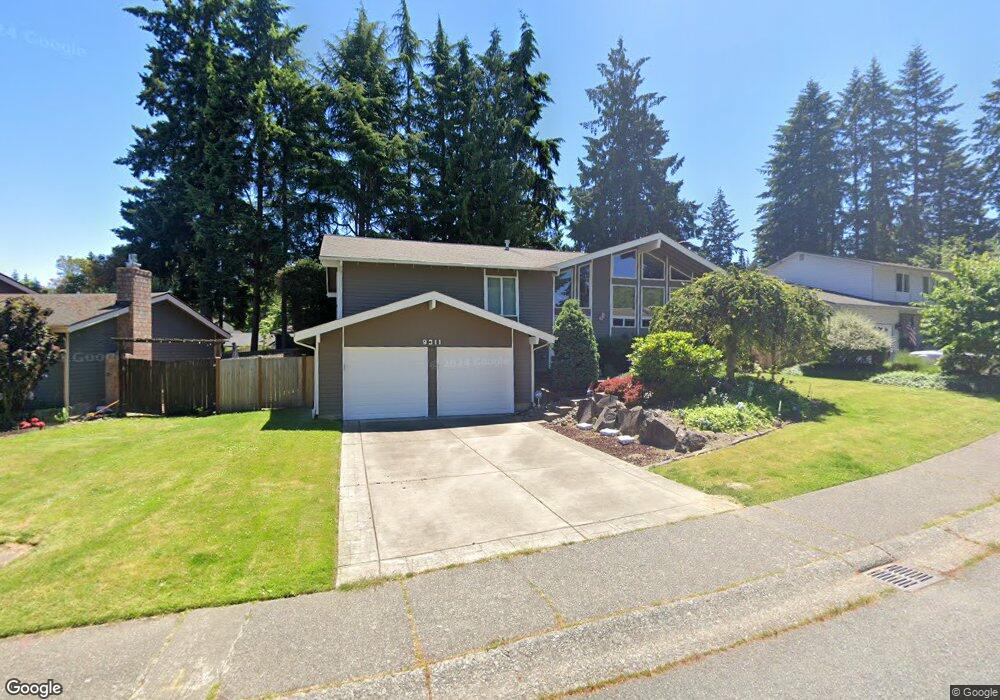
9311 NE 142nd St Bothell, WA 98011
Finn Hill NeighborhoodEstimated Value: $1,279,000 - $1,383,000
4
Beds
3
Baths
1,590
Sq Ft
$832/Sq Ft
Est. Value
About This Home
This home is located at 9311 NE 142nd St, Bothell, WA 98011 and is currently estimated at $1,323,081, approximately $832 per square foot. 9311 NE 142nd St is a home located in King County with nearby schools including Henry David Thoreau Elementary School, Finn Hill Middle School, and Juanita High School.
Ownership History
Date
Name
Owned For
Owner Type
Purchase Details
Closed on
Dec 2, 2024
Sold by
Katz Kristopher R
Bought by
Hung Wen-Shiu and Chen Yi-Hsuan
Current Estimated Value
Home Financials for this Owner
Home Financials are based on the most recent Mortgage that was taken out on this home.
Original Mortgage
$1,012,500
Outstanding Balance
$1,002,191
Interest Rate
6%
Mortgage Type
Credit Line Revolving
Estimated Equity
$320,890
Purchase Details
Closed on
May 12, 2014
Sold by
Andros Richard S and Andros Margaret A
Bought by
Katz Kristopher R
Home Financials for this Owner
Home Financials are based on the most recent Mortgage that was taken out on this home.
Original Mortgage
$417,000
Interest Rate
4.31%
Mortgage Type
New Conventional
Purchase Details
Closed on
Aug 5, 1992
Sold by
Andros Richard S Etal
Bought by
Andros Richard S and Andros Margaret A
Create a Home Valuation Report for This Property
The Home Valuation Report is an in-depth analysis detailing your home's value as well as a comparison with similar homes in the area
Home Values in the Area
Average Home Value in this Area
Purchase History
| Date | Buyer | Sale Price | Title Company |
|---|---|---|---|
| Hung Wen-Shiu | $1,350,000 | Chicago Title | |
| Hung Wen-Shiu | $1,350,000 | Chicago Title | |
| Katz Kristopher R | $505,000 | Cw Title Co | |
| Andros Richard S | -- | -- |
Source: Public Records
Mortgage History
| Date | Status | Borrower | Loan Amount |
|---|---|---|---|
| Open | Hung Wen-Shiu | $1,012,500 | |
| Closed | Hung Wen-Shiu | $1,012,500 | |
| Previous Owner | Katz Kristopher R | $417,000 |
Source: Public Records
Tax History
| Year | Tax Paid | Tax Assessment Tax Assessment Total Assessment is a certain percentage of the fair market value that is determined by local assessors to be the total taxable value of land and additions on the property. | Land | Improvement |
|---|---|---|---|---|
| 2024 | $9,297 | $1,133,000 | $469,000 | $664,000 |
| 2023 | $8,417 | $971,000 | $383,000 | $588,000 |
| 2022 | $7,968 | $1,215,000 | $456,000 | $759,000 |
| 2021 | $7,364 | $886,000 | $332,000 | $554,000 |
| 2020 | $7,184 | $747,000 | $275,000 | $472,000 |
| 2018 | $5,209 | $559,000 | $233,000 | $326,000 |
| 2017 | $4,735 | $498,000 | $208,000 | $290,000 |
| 2016 | $4,551 | $471,000 | $197,000 | $274,000 |
| 2015 | $4,137 | $446,000 | $187,000 | $259,000 |
| 2014 | -- | $389,000 | $170,000 | $219,000 |
| 2013 | -- | $320,000 | $140,000 | $180,000 |
Source: Public Records
Map
Nearby Homes
- 14208 93rd Ave NE
- 14248 92nd Place NE
- 14107 97th Ave NE
- 14142 97th Ave NE
- 13838 92nd Place NE
- 8801 NE 140th Place
- 9904 NE 142nd Place Unit C302
- 14505 Simonds Rd NE Unit C
- 9919 NE 144th Ln Unit 606
- 9919 NE 144th Ln Unit U603
- 13750 97th Ave NE
- 8708 NE 140th St Unit A
- 9211 NE 136th Place
- 8713 NE 144th St
- 9930 NE 144th Ln Unit 202
- 9813 NE 145th St
- 145 Xxx 100th Ave NE
- 13604 100th Ave NE
- 10214 NE 139th St
- 8403 NE 138th St
- 9311 NE 142nd St
- 9319 NE 142nd St
- 9319 NE 142nd St
- 9303 NE 142nd St
- 9310 NE 141st Place
- 9310 NE 141st Place
- 9302 NE 141st Place
- 9302 NE 141st Place
- 9318 NE 141st Place
- 9327 NE 142nd St
- 9310 NE 142nd St
- 9318 NE 141st Place
- 9318 NE 142nd St
- 9326 NE 142nd St
- 9326 NE 141st Place
- 9326 NE 141st Place
- 9335 NE 142nd St
- 9335 NE 142nd St
- 9334 NE 142nd St
- 14208 93rd Ave NE
Your Personal Tour Guide
Ask me questions while you tour the home.