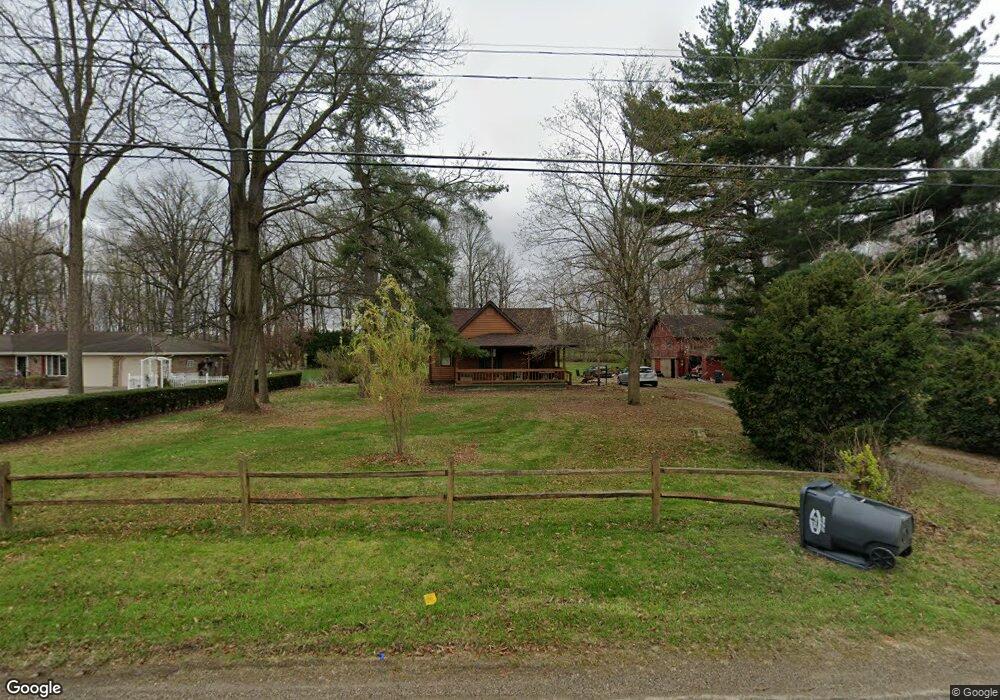
9311 W 1300 N Elwood, IN 46036
Estimated Value: $189,718 - $280,000
3
Beds
2
Baths
1,517
Sq Ft
$142/Sq Ft
Est. Value
About This Home
This home is located at 9311 W 1300 N, Elwood, IN 46036 and is currently estimated at $214,930, approximately $141 per square foot. 9311 W 1300 N is a home located in Madison County with nearby schools including Elwood Elementary School, Elwood Intermediate School, and Elwood Junior-Senior High School.
Ownership History
Date
Name
Owned For
Owner Type
Purchase Details
Closed on
Mar 4, 2016
Sold by
Neill Michael D and Neill Tammi
Bought by
Neill Trust
Current Estimated Value
Purchase Details
Closed on
Nov 17, 2006
Sold by
Bannister George M and Bannister Margie T
Bought by
Neil Michael D and Neil Tammi
Home Financials for this Owner
Home Financials are based on the most recent Mortgage that was taken out on this home.
Original Mortgage
$120,000
Interest Rate
6.4%
Mortgage Type
New Conventional
Create a Home Valuation Report for This Property
The Home Valuation Report is an in-depth analysis detailing your home's value as well as a comparison with similar homes in the area
Home Values in the Area
Average Home Value in this Area
Purchase History
| Date | Buyer | Sale Price | Title Company |
|---|---|---|---|
| Neill Trust | -- | -- | |
| Neil Michael D | -- | -- |
Source: Public Records
Mortgage History
| Date | Status | Borrower | Loan Amount |
|---|---|---|---|
| Previous Owner | Neil Michael D | $120,000 |
Source: Public Records
Tax History Compared to Growth
Tax History
| Year | Tax Paid | Tax Assessment Tax Assessment Total Assessment is a certain percentage of the fair market value that is determined by local assessors to be the total taxable value of land and additions on the property. | Land | Improvement |
|---|---|---|---|---|
| 2024 | $1,024 | $110,100 | $27,100 | $83,000 |
| 2023 | $1,089 | $103,400 | $25,800 | $77,600 |
| 2022 | $1,084 | $102,200 | $24,600 | $77,600 |
| 2021 | $1,097 | $97,700 | $24,600 | $73,100 |
| 2020 | $1,070 | $93,200 | $23,400 | $69,800 |
| 2019 | $2,234 | $91,900 | $23,400 | $68,500 |
| 2018 | $1,051 | $89,100 | $23,400 | $65,700 |
| 2017 | $989 | $88,600 | $23,400 | $65,200 |
| 2016 | $1,061 | $99,200 | $23,400 | $75,800 |
| 2014 | $996 | $98,300 | $23,400 | $74,900 |
| 2013 | $996 | $98,300 | $23,400 | $74,900 |
Source: Public Records
Map
Nearby Homes