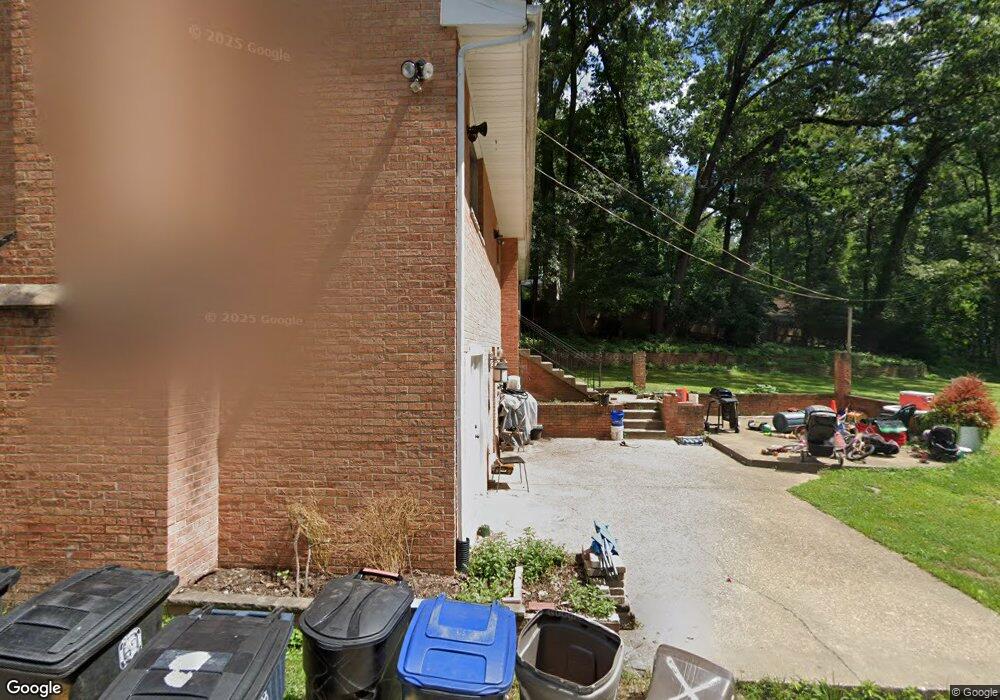
9314 Rolling View Dr Lanham, MD 20706
Estimated Value: $273,000 - $494,000
Studio
2
Baths
1,542
Sq Ft
$251/Sq Ft
Est. Value
About This Home
This home is located at 9314 Rolling View Dr, Lanham, MD 20706 and is currently estimated at $386,703, approximately $250 per square foot. 9314 Rolling View Dr is a home located in Prince George's County with nearby schools including James Mchenry Elementary School, Thomas Johnson Middle School, and Duval High School.
Ownership History
Date
Name
Owned For
Owner Type
Purchase Details
Closed on
Dec 26, 2007
Sold by
Amam Willow L
Bought by
Lopez David A
Current Estimated Value
Home Financials for this Owner
Home Financials are based on the most recent Mortgage that was taken out on this home.
Original Mortgage
$257,925
Outstanding Balance
$163,002
Interest Rate
6.27%
Mortgage Type
Purchase Money Mortgage
Estimated Equity
$223,701
Purchase Details
Closed on
Dec 21, 2007
Sold by
Amam Willow L
Bought by
Lopez David A
Home Financials for this Owner
Home Financials are based on the most recent Mortgage that was taken out on this home.
Original Mortgage
$257,925
Outstanding Balance
$163,002
Interest Rate
6.27%
Mortgage Type
Purchase Money Mortgage
Estimated Equity
$223,701
Purchase Details
Closed on
Jun 15, 2004
Sold by
Milone Patrick J
Bought by
Amam Willow L
Purchase Details
Closed on
Apr 14, 2004
Sold by
Milone Patrick J
Bought by
Amam Willow L
Purchase Details
Closed on
Nov 3, 1988
Sold by
Talley Ronald T
Bought by
Milone Patrick J
Create a Home Valuation Report for This Property
The Home Valuation Report is an in-depth analysis detailing your home's value as well as a comparison with similar homes in the area
Home Values in the Area
Average Home Value in this Area
Purchase History
| Date | Buyer | Sale Price | Title Company |
|---|---|---|---|
| Lopez David A | $271,500 | -- | |
| Lopez David A | $271,500 | -- | |
| Amam Willow L | $195,000 | -- | |
| Amam Willow L | $195,000 | -- | |
| Milone Patrick J | $100,000 | -- |
Source: Public Records
Mortgage History
| Date | Status | Borrower | Loan Amount |
|---|---|---|---|
| Open | Amam Willow L | $257,925 | |
| Closed | Lopez David A | $257,925 |
Source: Public Records
Tax History
| Year | Tax Paid | Tax Assessment Tax Assessment Total Assessment is a certain percentage of the fair market value that is determined by local assessors to be the total taxable value of land and additions on the property. | Land | Improvement |
|---|---|---|---|---|
| 2025 | $3,954 | $251,967 | -- | -- |
| 2024 | $3,954 | $239,233 | -- | -- |
| 2023 | $3,764 | $226,500 | $77,800 | $148,700 |
| 2022 | $3,673 | $220,400 | $0 | $0 |
| 2021 | $3,582 | $214,300 | $0 | $0 |
| 2020 | $3,492 | $208,200 | $77,800 | $130,400 |
| 2019 | $3,372 | $200,167 | $0 | $0 |
| 2018 | $3,253 | $192,133 | $0 | $0 |
| 2017 | $3,134 | $184,100 | $0 | $0 |
| 2016 | -- | $171,400 | $0 | $0 |
| 2015 | $3,762 | $158,700 | $0 | $0 |
| 2014 | $3,762 | $146,000 | $0 | $0 |
Source: Public Records
Map
Nearby Homes
- 9226 Fowler Ln
- 9233 Alcona St
- 4706 Cooks Hill Rd Unit 6 TO BE BUILT ELDER
- 9217 Fowler Ln
- 4704 Cooks Point Ct Unit 5
- 4703 Cooks Hill Rd Unit 13
- 9202 Cooks Point Ct Unit 15 MODEL HOME
- 4554 Kinmount Rd
- 8912 Keewatin Rd
- 4523 Kinmount Rd
- 9309 Kimbark Ave
- 5613 Gregory Dr
- 4217 Kinmount Rd
- 4224 Kinmount Rd
- 10535 John Glenn St
- 9033 Volta St
- 4818 Jefferson St
- 5554 Lanteen St Unit 1105
- 3708 Endicott Place
- 9013 Volta St
- 9315 Rolling View Dr
- 9235 Fowler Ln
- 9237 Fowler Ln
- 9233 Fowler Ln
- 9312 Rolling View Dr
- 9239 Fowler Ln
- 9231 Fowler Ln
- 9310 Rolling View Dr
- 9229 Fowler Ln
- 9313 Rolling View Dr
- 4611 Gladys Ct
- 9308 Rolling View Dr
- 9311 Rolling View Dr
- 9227 Fowler Ln
- 9238 Fowler Ln
- 9309 Rolling View Dr
- 9240 Fowler Ln
- 9234 Fowler Ln
- 9306 Rolling View Dr
- 9225 Fowler Ln
Your Personal Tour Guide
Ask me questions while you tour the home.