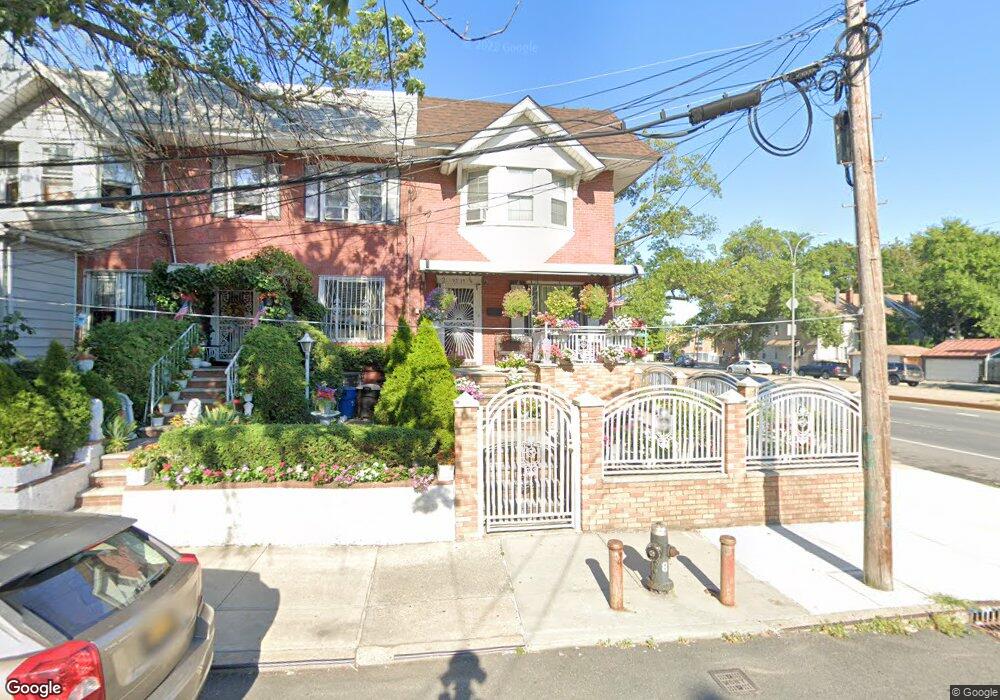
9315 95th St Woodhaven, NY 11421
Woodhaven NeighborhoodEstimated Value: $616,465 - $723,000
--
Bed
--
Bath
1,292
Sq Ft
$531/Sq Ft
Est. Value
About This Home
This home is located at 9315 95th St, Woodhaven, NY 11421 and is currently estimated at $686,366, approximately $531 per square foot. 9315 95th St is a home located in Queens County with nearby schools including P.S. 273, Jhs 210 Elizabeth Blackwell, and Richmond Hill High School.
Ownership History
Date
Name
Owned For
Owner Type
Purchase Details
Closed on
Apr 27, 2012
Sold by
Haridat Halima and Haridat Kumar
Bought by
Haridat Halima
Current Estimated Value
Purchase Details
Closed on
Dec 29, 1998
Sold by
Lee Ming Chun
Bought by
Haridat Kumar and Haridat Halima
Home Financials for this Owner
Home Financials are based on the most recent Mortgage that was taken out on this home.
Original Mortgage
$115,000
Interest Rate
6.78%
Mortgage Type
Purchase Money Mortgage
Create a Home Valuation Report for This Property
The Home Valuation Report is an in-depth analysis detailing your home's value as well as a comparison with similar homes in the area
Home Values in the Area
Average Home Value in this Area
Purchase History
| Date | Buyer | Sale Price | Title Company |
|---|---|---|---|
| Haridat Halima | -- | -- | |
| Haridat Kumar | $165,000 | Commonwealth Land Title Ins |
Source: Public Records
Mortgage History
| Date | Status | Borrower | Loan Amount |
|---|---|---|---|
| Previous Owner | Haridat Kumar | $115,000 |
Source: Public Records
Tax History Compared to Growth
Tax History
| Year | Tax Paid | Tax Assessment Tax Assessment Total Assessment is a certain percentage of the fair market value that is determined by local assessors to be the total taxable value of land and additions on the property. | Land | Improvement |
|---|---|---|---|---|
| 2025 | $5,463 | $29,549 | $8,788 | $20,761 |
| 2024 | $5,475 | $28,598 | $9,264 | $19,334 |
| 2023 | $5,276 | $27,666 | $9,090 | $18,576 |
| 2022 | $4,924 | $38,280 | $12,420 | $25,860 |
| 2021 | $4,886 | $37,260 | $12,420 | $24,840 |
| 2020 | $4,916 | $34,680 | $12,420 | $22,260 |
| 2019 | $4,693 | $35,340 | $12,420 | $22,920 |
| 2018 | $4,402 | $23,055 | $9,073 | $13,982 |
| 2017 | $4,134 | $21,751 | $9,479 | $12,272 |
| 2016 | $3,792 | $21,751 | $9,479 | $12,272 |
| 2015 | $2,255 | $20,520 | $11,888 | $8,632 |
| 2014 | $2,255 | $19,860 | $13,800 | $6,060 |
Source: Public Records
Map
Nearby Homes