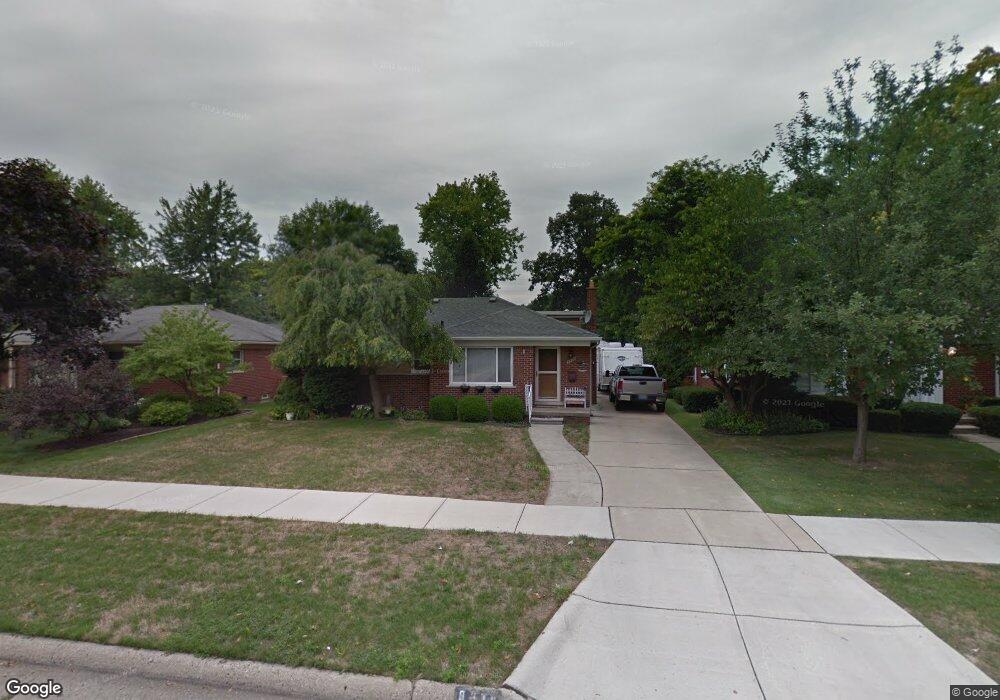
9315 San Jose Redford, MI 48239
Estimated Value: $178,614 - $229,000
--
Bed
--
Bath
1,110
Sq Ft
$188/Sq Ft
Est. Value
About This Home
This home is located at 9315 San Jose, Redford, MI 48239 and is currently estimated at $208,904, approximately $188 per square foot. 9315 San Jose is a home located in Wayne County with nearby schools including John D. Pierce Middle School, Lee M. Thurston High School, and Westfield Charter Academy.
Ownership History
Date
Name
Owned For
Owner Type
Purchase Details
Closed on
Oct 3, 2022
Sold by
Foy Sarah Marie
Bought by
Foy Sarah Marie and Foy Patrick John
Current Estimated Value
Purchase Details
Closed on
Jul 19, 2012
Sold by
Foy Sarah M and Snyder Sarah
Bought by
Foy Sarah M and Foy Patrick J
Home Financials for this Owner
Home Financials are based on the most recent Mortgage that was taken out on this home.
Original Mortgage
$132,000
Interest Rate
3.73%
Mortgage Type
New Conventional
Purchase Details
Closed on
Jan 14, 2003
Sold by
Maida Adam J
Bought by
Snyder Sarah
Create a Home Valuation Report for This Property
The Home Valuation Report is an in-depth analysis detailing your home's value as well as a comparison with similar homes in the area
Home Values in the Area
Average Home Value in this Area
Purchase History
| Date | Buyer | Sale Price | Title Company |
|---|---|---|---|
| Foy Sarah Marie | -- | Premier Title | |
| Foy Sarah M | -- | None Available | |
| Snyder Sarah | $114,000 | Greco Title |
Source: Public Records
Mortgage History
| Date | Status | Borrower | Loan Amount |
|---|---|---|---|
| Previous Owner | Foy Sarah M | $132,000 |
Source: Public Records
Tax History Compared to Growth
Tax History
| Year | Tax Paid | Tax Assessment Tax Assessment Total Assessment is a certain percentage of the fair market value that is determined by local assessors to be the total taxable value of land and additions on the property. | Land | Improvement |
|---|---|---|---|---|
| 2025 | $810 | $95,100 | $0 | $0 |
| 2024 | $810 | $89,100 | $0 | $0 |
| 2023 | $775 | $78,400 | $0 | $0 |
| 2022 | $2,270 | $70,100 | $0 | $0 |
| 2021 | $2,206 | $66,700 | $0 | $0 |
| 2020 | $2,176 | $59,100 | $0 | $0 |
| 2019 | $2,129 | $52,000 | $0 | $0 |
| 2018 | $698 | $44,300 | $0 | $0 |
| 2017 | $2,415 | $41,900 | $0 | $0 |
| 2016 | $1,882 | $37,600 | $0 | $0 |
| 2015 | $2,932 | $33,600 | $0 | $0 |
| 2013 | $2,840 | $29,000 | $0 | $0 |
| 2012 | $1,923 | $31,500 | $7,900 | $23,600 |
Source: Public Records
Map
Nearby Homes