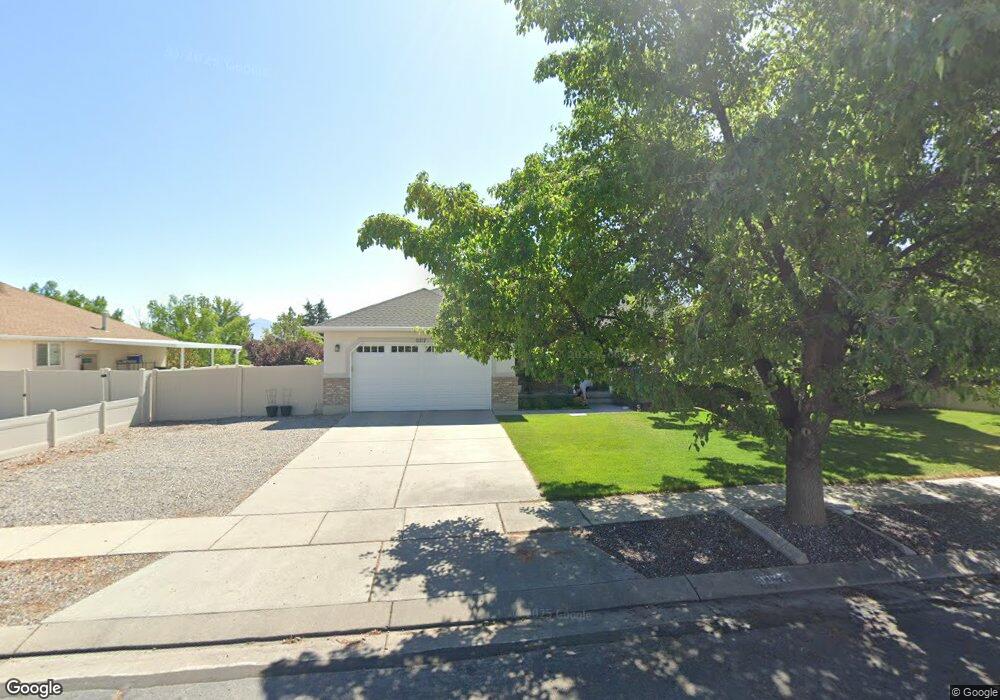
9317 Fire Lily Ln West Jordan, UT 84081
Copper Hills NeighborhoodEstimated Value: $537,000 - $626,000
3
Beds
2
Baths
1,353
Sq Ft
$423/Sq Ft
Est. Value
About This Home
This home is located at 9317 Fire Lily Ln, West Jordan, UT 84081 and is currently estimated at $572,988, approximately $423 per square foot. 9317 Fire Lily Ln is a home located in Salt Lake County with nearby schools including Copper Canyon School, West Hills Middle School, and Copper Hills High School.
Ownership History
Date
Name
Owned For
Owner Type
Purchase Details
Closed on
Oct 16, 1998
Sold by
Tarpenning Greg and Lawson Bobby L
Bought by
Lawson Bobby L and Lawson Cherie G
Current Estimated Value
Home Financials for this Owner
Home Financials are based on the most recent Mortgage that was taken out on this home.
Original Mortgage
$138,700
Interest Rate
6.37%
Purchase Details
Closed on
Aug 29, 1997
Sold by
Tarpenning Greg
Bought by
Tarpenning Greg and Lawson Bobby L
Home Financials for this Owner
Home Financials are based on the most recent Mortgage that was taken out on this home.
Original Mortgage
$105,000
Interest Rate
7.61%
Purchase Details
Closed on
Aug 13, 1997
Sold by
Lane Myers Construction L L C
Bought by
Tarpenning Greg
Home Financials for this Owner
Home Financials are based on the most recent Mortgage that was taken out on this home.
Original Mortgage
$105,000
Interest Rate
7.61%
Purchase Details
Closed on
Aug 27, 1996
Sold by
Kfp Corp
Bought by
Lane Myers Construction L L C
Create a Home Valuation Report for This Property
The Home Valuation Report is an in-depth analysis detailing your home's value as well as a comparison with similar homes in the area
Home Values in the Area
Average Home Value in this Area
Purchase History
| Date | Buyer | Sale Price | Title Company |
|---|---|---|---|
| Lawson Bobby L | -- | -- | |
| Tarpenning Greg | -- | -- | |
| Tarpenning Greg | -- | -- | |
| Lane Myers Construction L L C | -- | -- |
Source: Public Records
Mortgage History
| Date | Status | Borrower | Loan Amount |
|---|---|---|---|
| Closed | Lawson Bobby L | $138,700 | |
| Previous Owner | Tarpenning Greg | $105,000 |
Source: Public Records
Tax History Compared to Growth
Tax History
| Year | Tax Paid | Tax Assessment Tax Assessment Total Assessment is a certain percentage of the fair market value that is determined by local assessors to be the total taxable value of land and additions on the property. | Land | Improvement |
|---|---|---|---|---|
| 2025 | $2,662 | $529,500 | $192,000 | $337,500 |
| 2024 | $2,662 | $512,100 | $185,700 | $326,400 |
| 2023 | $2,706 | $490,700 | $182,100 | $308,600 |
| 2022 | $2,715 | $484,400 | $178,500 | $305,900 |
| 2021 | $2,279 | $370,100 | $136,500 | $233,600 |
| 2020 | $2,117 | $322,600 | $121,800 | $200,800 |
| 2019 | $2,131 | $318,400 | $121,800 | $196,600 |
| 2018 | $2,012 | $298,200 | $119,400 | $178,800 |
| 2017 | $1,759 | $259,600 | $119,400 | $140,200 |
| 2016 | $1,715 | $237,800 | $119,400 | $118,400 |
| 2015 | $1,705 | $230,500 | $116,000 | $114,500 |
| 2014 | $1,629 | $216,800 | $110,300 | $106,500 |
Source: Public Records
Map
Nearby Homes
- 9332 S Wild Clover Ln
- 4904 Wild Acres Dr
- 5098 Cherry Laurel Ln
- 9118 S Wisteria Way
- 4565 Lennox Dr
- 9353 S 4460 W
- 4624 Pine Crossing Dr
- 4424 W Skye Dr
- 8854 Rocky Creek Dr
- 4887 W 8620 S
- 8941 S Sun Leaf Dr
- 4554 Birdie Way
- 10027 Birdie Way
- 9851 S Birdie Way
- 8577 Autumn Gold Cir
- 8793 S Big Bar Ct
- 10117 S Glenmoor Dr
- 5582 Washoe Cove
- 9375 S Laurel Ridge Cir
- 8441 S Spratling Dr
- 9303 Fire Lily Ln
- 9331 S Fire Lily Ln
- 9303 S Fire Lily Ln
- 9331 Fire Lily Ln
- 9322 S Star Lily Cir
- 9322 Star Lily Cir
- 9308 S Star Lily Cir
- 9308 Star Lily Cir
- 9345 S Fire Lily Ln
- 9291 Fire Lily Ln
- 9318 Fire Lily Ln
- 9345 Fire Lily Ln
- 9318 S Fire Lily Ln
- 9304 Fire Lily Ln
- 9334 S Fire Lily Ln
- 9334 Fire Lily Ln
- 9294 Star Lily Cir
- 9332 Star Lily Cir
- 9292 Fire Lily Ln
- 9346 Fire Lily Ln