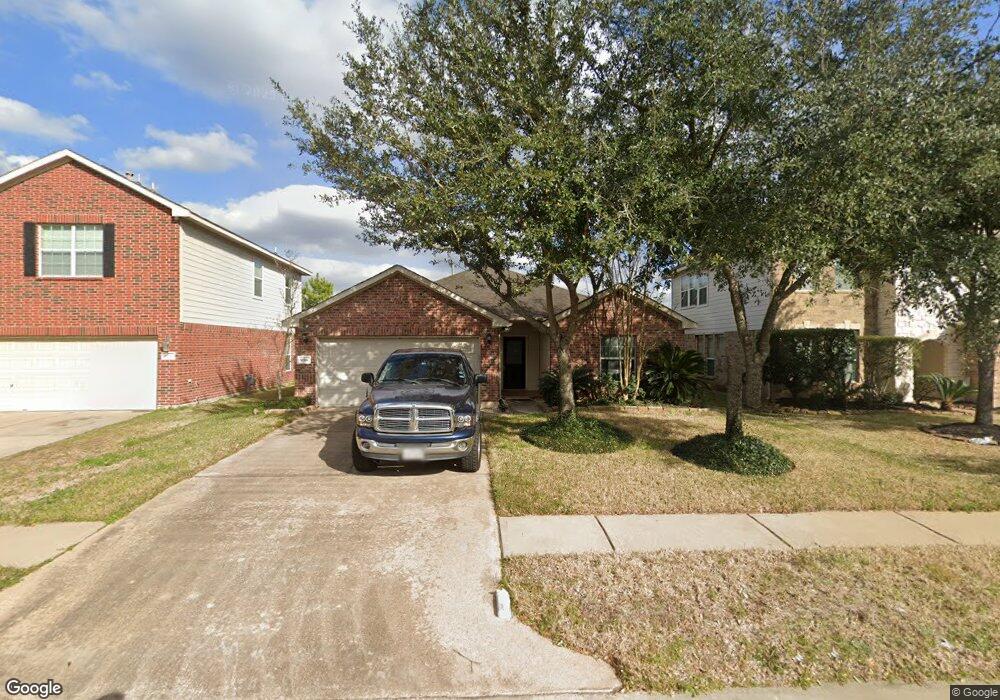
9318 Vander Rock Dr Houston, TX 77095
Canyon Lakes at Stonegate NeighborhoodEstimated Value: $250,264 - $299,000
3
Beds
2
Baths
1,468
Sq Ft
$185/Sq Ft
Est. Value
About This Home
This home is located at 9318 Vander Rock Dr, Houston, TX 77095 and is currently estimated at $271,566, approximately $184 per square foot. 9318 Vander Rock Dr is a home located in Harris County with nearby schools including Birkes Elementary School, Aragon Middle School, and Langham Creek High School.
Ownership History
Date
Name
Owned For
Owner Type
Purchase Details
Closed on
Jan 26, 2011
Sold by
Bank Of America National Association
Bought by
Garcia Michael Omar
Current Estimated Value
Home Financials for this Owner
Home Financials are based on the most recent Mortgage that was taken out on this home.
Original Mortgage
$107,211
Outstanding Balance
$73,675
Interest Rate
4.87%
Mortgage Type
FHA
Estimated Equity
$197,891
Purchase Details
Closed on
Feb 2, 2010
Sold by
Easley Michelle and Easley Sean
Bought by
Bank Of America National Association
Purchase Details
Closed on
Oct 30, 2006
Sold by
Castlerock Communities Lp
Bought by
Easley Sean and Easley Michelle
Home Financials for this Owner
Home Financials are based on the most recent Mortgage that was taken out on this home.
Original Mortgage
$28,167
Interest Rate
6.28%
Mortgage Type
Stand Alone Second
Create a Home Valuation Report for This Property
The Home Valuation Report is an in-depth analysis detailing your home's value as well as a comparison with similar homes in the area
Home Values in the Area
Average Home Value in this Area
Purchase History
| Date | Buyer | Sale Price | Title Company |
|---|---|---|---|
| Garcia Michael Omar | -- | First American Title | |
| Bank Of America National Association | $129,820 | None Available | |
| Easley Sean | -- | Ameripoint Title |
Source: Public Records
Mortgage History
| Date | Status | Borrower | Loan Amount |
|---|---|---|---|
| Open | Garcia Michael Omar | $107,211 | |
| Previous Owner | Easley Sean | $28,167 | |
| Previous Owner | Easley Sean | $112,670 |
Source: Public Records
Tax History Compared to Growth
Tax History
| Year | Tax Paid | Tax Assessment Tax Assessment Total Assessment is a certain percentage of the fair market value that is determined by local assessors to be the total taxable value of land and additions on the property. | Land | Improvement |
|---|---|---|---|---|
| 2025 | $3,279 | $252,387 | $66,408 | $185,979 |
| 2024 | $3,279 | $234,516 | $60,318 | $174,198 |
| 2023 | $3,279 | $264,000 | $60,318 | $203,682 |
| 2022 | $4,974 | $225,188 | $44,658 | $180,530 |
| 2021 | $4,789 | $186,992 | $44,658 | $142,334 |
| 2020 | $4,755 | $178,146 | $27,839 | $150,307 |
| 2019 | $4,616 | $167,805 | $26,099 | $141,706 |
| 2018 | $1,449 | $156,996 | $26,099 | $130,897 |
| 2017 | $4,124 | $151,829 | $26,099 | $125,730 |
| 2016 | $3,985 | $146,722 | $26,099 | $120,623 |
| 2015 | $2,811 | $146,722 | $26,099 | $120,623 |
| 2014 | $2,811 | $136,909 | $26,099 | $110,810 |
Source: Public Records
Map
Nearby Homes
- 16827 Newlight Bend Dr
- 9406 Morley Lake Dr
- 8855 Distant Woods Dr
- 8714 Ridgebury Cir
- 17038 Sperry Landing Dr
- 16839 Mammoth Springs Dr
- 16602 Grenada Falls Dr
- 16827 Libson Falls Dr
- 9631 Gorman Brook Dr
- 16758 Mammoth Springs Dr
- 9714 Coyote Creek Dr
- 16750 Libson Falls Dr
- 9735 Coyote Creek Dr
- 16802 Pine Castle Dr
- 16635 Greenbriar Point Ln
- 16611 Gentle Stone Dr
- 17215 Shallow Lake Ln
- 8711 Preston Field Ln
- 16410 Dawnblush Ct
- 9747 Wheaton Edge Ln
- 9322 Vander Rock Dr
- 9314 Vander Rock Dr
- 9310 Vander Rock Dr
- 9326 Vander Rock Dr
- 9306 Vander Rock Dr
- 9319 Vander Rock Dr
- 9323 Vander Rock Dr
- 9334 Vander Rock Dr
- 9327 Vander Rock Dr
- 9302 Vander Rock Dr
- 9331 Vander Rock Dr
- 9214 Taftsberry Dr
- 16831 Newlight Bend Dr
- 9303 Langley Springs Dr
- 9203 Taftsberry Dr
- 9218 Taftsberry Dr
- 16903 Melvin Oaks Ct
- 9307 Langley Springs Dr
- 9207 Taftsberry Dr
- 16906 Melvin Oaks Ct