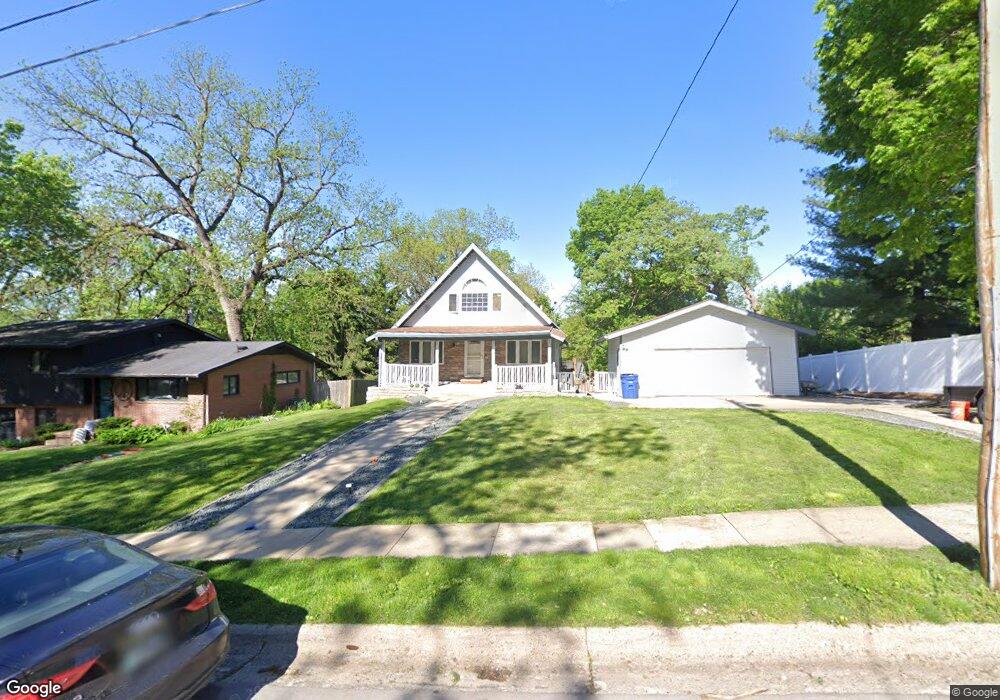
932 59th St Des Moines, IA 50312
Waveland Woods NeighborhoodEstimated Value: $440,000 - $477,000
3
Beds
2
Baths
2,398
Sq Ft
$191/Sq Ft
Est. Value
About This Home
This home is located at 932 59th St, Des Moines, IA 50312 and is currently estimated at $457,997, approximately $190 per square foot. 932 59th St is a home located in Polk County with nearby schools including Windsor Elementary School, Merrill Middle School, and Roosevelt High School.
Ownership History
Date
Name
Owned For
Owner Type
Purchase Details
Closed on
May 4, 2004
Sold by
Carmi Ofir
Bought by
Gore Teresa L
Current Estimated Value
Purchase Details
Closed on
Jan 6, 2003
Sold by
Shnurman Frances and Shnurman Meyer
Bought by
Carmi Ofir
Purchase Details
Closed on
May 5, 2000
Sold by
Frances Shnurman Revocable Trust
Bought by
Carmi Ofir
Home Financials for this Owner
Home Financials are based on the most recent Mortgage that was taken out on this home.
Original Mortgage
$59,400
Interest Rate
10%
Mortgage Type
Seller Take Back
Create a Home Valuation Report for This Property
The Home Valuation Report is an in-depth analysis detailing your home's value as well as a comparison with similar homes in the area
Home Values in the Area
Average Home Value in this Area
Purchase History
| Date | Buyer | Sale Price | Title Company |
|---|---|---|---|
| Gore Teresa L | -- | -- | |
| Carmi Ofir | $62,187 | -- | |
| Carmi Ofir | $66,000 | -- |
Source: Public Records
Mortgage History
| Date | Status | Borrower | Loan Amount |
|---|---|---|---|
| Previous Owner | Carmi Ofir | $59,400 |
Source: Public Records
Tax History
| Year | Tax Paid | Tax Assessment Tax Assessment Total Assessment is a certain percentage of the fair market value that is determined by local assessors to be the total taxable value of land and additions on the property. | Land | Improvement |
|---|---|---|---|---|
| 2025 | $8,764 | $496,600 | $66,100 | $430,500 |
| 2024 | $8,764 | $445,500 | $58,300 | $387,200 |
| 2023 | $8,676 | $445,500 | $58,300 | $387,200 |
| 2022 | $8,610 | $368,100 | $50,200 | $317,900 |
| 2021 | $8,512 | $368,100 | $50,200 | $317,900 |
| 2020 | $9,008 | $341,100 | $46,500 | $294,600 |
| 2019 | $8,328 | $341,100 | $46,500 | $294,600 |
| 2018 | $8,244 | $309,900 | $41,200 | $268,700 |
| 2017 | $7,286 | $309,900 | $41,200 | $268,700 |
| 2016 | $6,586 | $269,400 | $32,600 | $236,800 |
| 2015 | $6,586 | $249,900 | $32,600 | $217,300 |
| 2014 | $5,872 | $229,300 | $29,200 | $200,100 |
Source: Public Records
Map
Nearby Homes
- 5815 Kingman Ave
- 6002 Rollins Ave
- 1000 56th St
- 1051 57th St
- 1010 56th St
- 1122 59th St
- 6128 Pleasant Dr
- 6131 Harwood Dr
- 5615 Harwood Dr
- 5638 University Ave
- 948 65th St
- 686 63rd St
- 1211 56th St
- 6750 School St Unit 205
- 6012 N Waterbury Rd
- 6008 Carpenter Ave
- 743 53rd St
- 1243 57th St
- 1337 60th St
- 5810 Ingersoll Ave
Your Personal Tour Guide
Ask me questions while you tour the home.