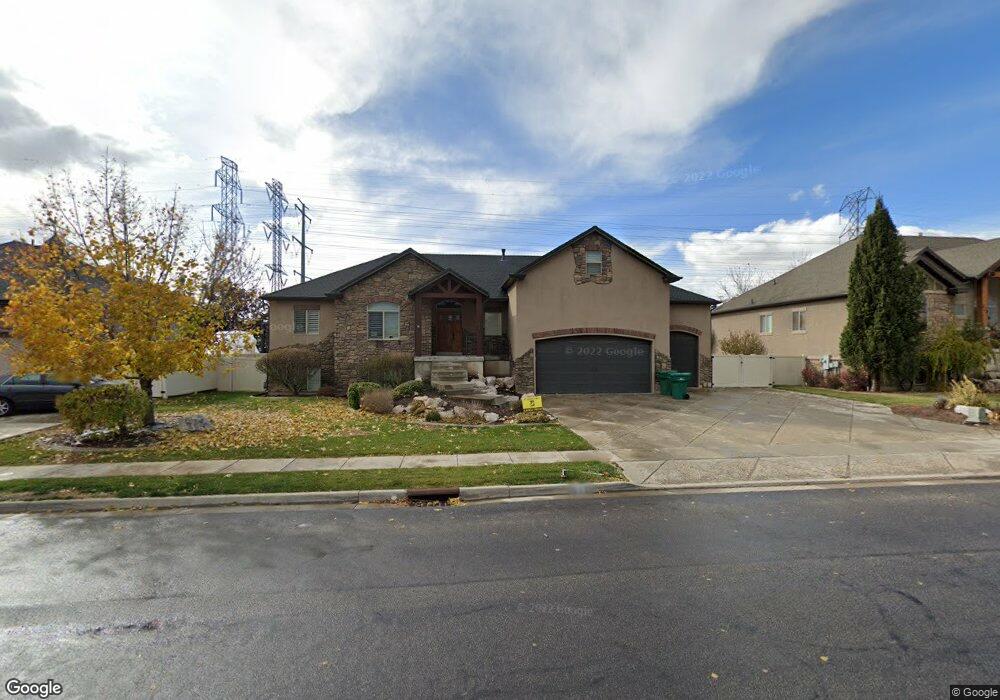
932 Bridgecreek Ln Layton, UT 84041
Estimated Value: $878,000 - $1,255,044
3
Beds
2
Baths
2,449
Sq Ft
$429/Sq Ft
Est. Value
About This Home
This home is located at 932 Bridgecreek Ln, Layton, UT 84041 and is currently estimated at $1,051,761, approximately $429 per square foot. 932 Bridgecreek Ln is a home located in Davis County with nearby schools including Heritage Elementary School, Shoreline Junior High School, and Layton High School.
Ownership History
Date
Name
Owned For
Owner Type
Purchase Details
Closed on
Jan 11, 2013
Sold by
Tarbet Benjamin N
Bought by
Tarbet Aimee R and Tarbet Benjamin N
Current Estimated Value
Home Financials for this Owner
Home Financials are based on the most recent Mortgage that was taken out on this home.
Original Mortgage
$372,700
Outstanding Balance
$257,489
Interest Rate
3.31%
Mortgage Type
New Conventional
Estimated Equity
$794,272
Purchase Details
Closed on
Feb 23, 2007
Sold by
Green & Green Lc
Bought by
Tarbet Benjamin N
Home Financials for this Owner
Home Financials are based on the most recent Mortgage that was taken out on this home.
Original Mortgage
$340,000
Interest Rate
6.21%
Mortgage Type
Construction
Create a Home Valuation Report for This Property
The Home Valuation Report is an in-depth analysis detailing your home's value as well as a comparison with similar homes in the area
Home Values in the Area
Average Home Value in this Area
Purchase History
| Date | Buyer | Sale Price | Title Company |
|---|---|---|---|
| Tarbet Aimee R | -- | Founders Title Co | |
| Tarbet Benjamin N | -- | Security Title |
Source: Public Records
Mortgage History
| Date | Status | Borrower | Loan Amount |
|---|---|---|---|
| Open | Tarbet Aimee R | $372,700 | |
| Closed | Tarbet Benjamin N | $340,000 |
Source: Public Records
Tax History Compared to Growth
Tax History
| Year | Tax Paid | Tax Assessment Tax Assessment Total Assessment is a certain percentage of the fair market value that is determined by local assessors to be the total taxable value of land and additions on the property. | Land | Improvement |
|---|---|---|---|---|
| 2025 | $7,255 | $761,530 | $426,173 | $335,357 |
| 2024 | $6,957 | $735,680 | $417,900 | $317,780 |
| 2023 | $6,874 | $1,116,000 | $457,540 | $658,460 |
| 2022 | $6,944 | $622,050 | $215,788 | $406,262 |
| 2021 | $6,288 | $839,000 | $309,973 | $529,027 |
| 2020 | $5,451 | $694,000 | $274,559 | $419,441 |
| 2019 | $5,188 | $644,000 | $249,133 | $394,867 |
| 2018 | $4,901 | $606,000 | $234,888 | $371,112 |
| 2016 | $4,458 | $327,491 | $130,479 | $197,012 |
| 2015 | $4,380 | $305,436 | $130,479 | $174,957 |
| 2014 | $4,366 | $311,325 | $121,513 | $189,812 |
| 2013 | -- | $250,743 | $85,395 | $165,348 |
Source: Public Records
Map
Nearby Homes
- 796 S Rock Creek Corner
- 920 S 1700 W Unit 1
- 1124 S Neville St
- 583 S Alberta Spruce Dr
- 1234 S Grace Way
- 1278 S Grace Way
- Creighton Farmhouse Plan at Angel Hill
- 557 S Angel St
- 1042 W Shoreline Dr
- 1494 S Mica Ln
- 2182 W Evergreen Way Unit 143
- 1038 S Old Towne Rd
- 2056 W Phillips St
- 1015 W 350 S
- 1910 W Bonneville Ln
- 774 W Farming Way
- 562 S 850 W
- 362 S 950 W
- 296 S 950 W
- 233 Heathermoor Ln
- 932 Bridgecreek Ln Unit 502
- 918 S Bridge Creek Ln W
- 918 Bridgecreek Ln
- 918 Bridgecreek Ln Unit 503
- 946 Bridgecreek Ln
- 958 S Bridge Creek Ln W
- 906 Bridgecreek Ln
- 958 Bridgecreek Ln
- 1612 W Timbercreek Ln
- 906 Bridgecreek Ln
- 1605 W Timbercreek Ln
- 1639 Boulder Creek Ln
- 890 Bridgecreek Ln
- 1598 W Timbercreek Ln
- 972 Bridgecreek Ln
- 1591 W Timbercreek Ln
- 1625 Boulder Creek Ln
- 880 Bridgecreek Ln
- 1584 W Timbercreek Ln
- 1584 W Timbercreek Ln