Estimated Value: $127,079 - $167,000
3
Beds
1
Bath
800
Sq Ft
$180/Sq Ft
Est. Value
About This Home
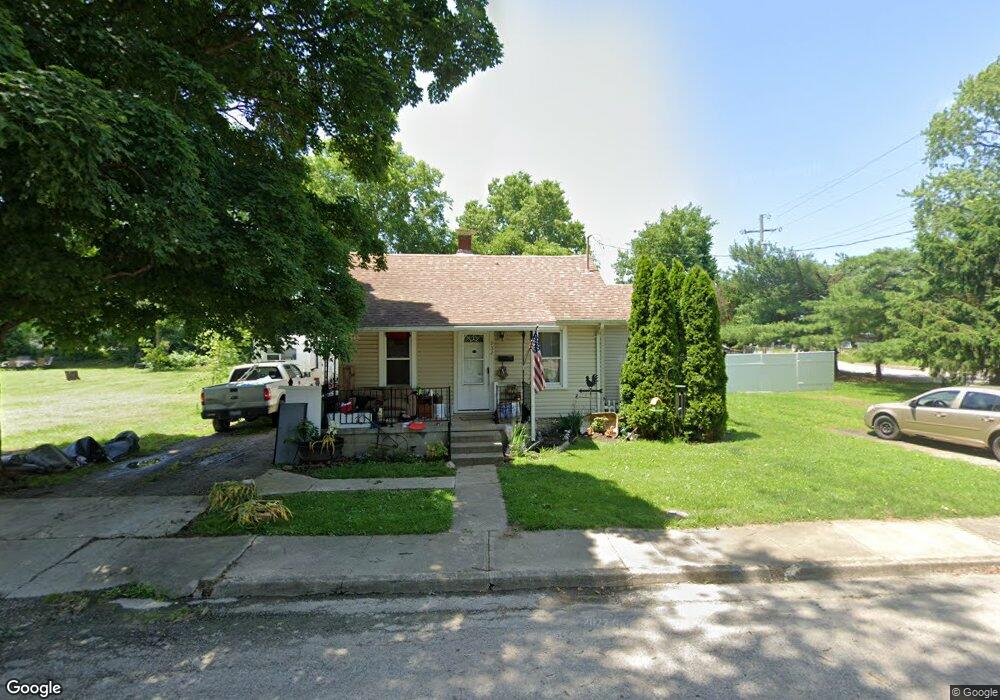
This home is located at 932 Catherine St, Xenia, OH 45385 and is currently estimated at $144,020, approximately $180 per square foot. 932 Catherine St is a home located in Greene County with nearby schools including Xenia High School, Summit Academy Community School for Alternative Learners - Xenia, and Legacy Christian Academy.
Ownership History
Date
Name
Owned For
Owner Type
Purchase Details
Closed on
Jun 24, 2019
Sold by
Wilson Michael A and Wilson Vicki J
Bought by
Wilson Vicki J
Current Estimated Value
Purchase Details
Closed on
Aug 6, 2009
Sold by
Jfe Holdings Ltd
Bought by
Wilson Michael A and Wilson Vicki J
Home Financials for this Owner
Home Financials are based on the most recent Mortgage that was taken out on this home.
Original Mortgage
$47,920
Outstanding Balance
$31,482
Interest Rate
5.36%
Mortgage Type
Unknown
Estimated Equity
$112,538
Purchase Details
Closed on
Mar 13, 2008
Sold by
Richey Connie L and Richey Andy
Bought by
Jfe Holdings Ltd
Purchase Details
Closed on
Jun 6, 2000
Sold by
Lawwill Brenda L and Bullen Brenda L
Bought by
Lawwill Mickey J and Lawwill Nanette
Home Financials for this Owner
Home Financials are based on the most recent Mortgage that was taken out on this home.
Original Mortgage
$64,000
Interest Rate
10.25%
Create a Home Valuation Report for This Property
The Home Valuation Report is an in-depth analysis detailing your home's value as well as a comparison with similar homes in the area
Home Values in the Area
Average Home Value in this Area
Purchase History
| Date | Buyer | Sale Price | Title Company |
|---|---|---|---|
| Wilson Vicki J | -- | None Available | |
| Wilson Michael A | $59,900 | Attorney | |
| Jfe Holdings Ltd | -- | Attorney | |
| Lawwill Mickey J | -- | -- |
Source: Public Records
Mortgage History
| Date | Status | Borrower | Loan Amount |
|---|---|---|---|
| Open | Wilson Michael A | $47,920 | |
| Previous Owner | Lawwill Mickey J | $64,000 |
Source: Public Records
Tax History Compared to Growth
Tax History
| Year | Tax Paid | Tax Assessment Tax Assessment Total Assessment is a certain percentage of the fair market value that is determined by local assessors to be the total taxable value of land and additions on the property. | Land | Improvement |
|---|---|---|---|---|
| 2024 | $1,084 | $25,330 | $3,380 | $21,950 |
| 2023 | $1,084 | $25,330 | $3,380 | $21,950 |
| 2022 | $968 | $19,290 | $2,710 | $16,580 |
| 2021 | $981 | $19,290 | $2,710 | $16,580 |
| 2020 | $940 | $19,290 | $2,710 | $16,580 |
| 2019 | $956 | $18,470 | $2,860 | $15,610 |
| 2018 | $959 | $18,470 | $2,860 | $15,610 |
| 2017 | $917 | $18,470 | $2,860 | $15,610 |
| 2016 | $918 | $17,340 | $2,860 | $14,480 |
| 2015 | $921 | $17,340 | $2,860 | $14,480 |
| 2014 | $881 | $17,340 | $2,860 | $14,480 |
Source: Public Records
Map
Nearby Homes
- 902 N Detroit St
- 878 N Detroit St
- 659 N King St
- 1038 Frederick Dr
- 613 N West St
- 1171 N Detroit St
- 516 N King St
- 137 Pleasant St
- 509 Antrim Rd
- 883 Omard Dr
- 912 Omard Dr
- 119 Park Dr
- 508 Marshall Dr
- 513 Redbud Ln
- 479 N Stadium Dr
- 348 S Stadium Dr
- 214 Corwin Ave
- 0 W Church St
- 568 Louise Dr
- 1791 Palmer Ct
- 918 Catherine St
- 908 Catherine St
- 908 Catherine St
- 113 W Harbine Ave
- 960 Catherine St
- 921 Catherine St
- 888 Catherine St
- 116 W Harbine Ave
- 911 Catherine St
- 901 Catherine St
- 880 Catherine St
- 880 Florence St
- 872 Florence St
- 990 Catherine St
- 860 Florence St
- 98 W Harbine Ave
- 881 Catherine St
- 870 Catherine St
- 852 Florence St
- 981 Catherine St