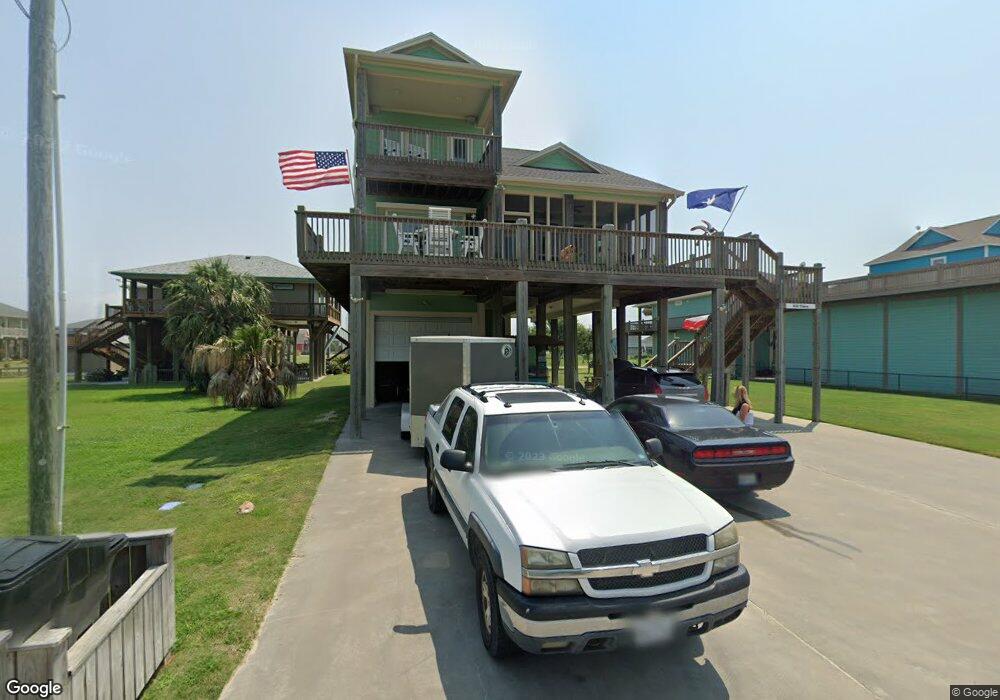
932 Clara St Unit 90-91 Bolivar Peninsula, TX 77650
Crystal Beach NeighborhoodEstimated Value: $614,000 - $740,000
4
Beds
1
Bath
2,114
Sq Ft
$319/Sq Ft
Est. Value
About This Home
This home is located at 932 Clara St Unit 90-91, Bolivar Peninsula, TX 77650 and is currently estimated at $675,312, approximately $319 per square foot. 932 Clara St Unit 90-91 is a home located in Galveston County with nearby schools including Morgan Elementary Magnet School, Burnet STREAM Magnet School, and Parker Elementary School.
Ownership History
Date
Name
Owned For
Owner Type
Purchase Details
Closed on
Oct 4, 2019
Sold by
Collier Patrick and Collier Lisa
Bought by
Tweet Cheryl and Tweet Rosney L
Current Estimated Value
Home Financials for this Owner
Home Financials are based on the most recent Mortgage that was taken out on this home.
Original Mortgage
$359,910
Outstanding Balance
$315,299
Interest Rate
3.5%
Mortgage Type
New Conventional
Estimated Equity
$360,013
Purchase Details
Closed on
May 19, 2014
Sold by
Gonzales Jsr Raymond and Gonzales Rosa C
Bought by
Collier Patrick and Collier Lisa
Create a Home Valuation Report for This Property
The Home Valuation Report is an in-depth analysis detailing your home's value as well as a comparison with similar homes in the area
Home Values in the Area
Average Home Value in this Area
Purchase History
| Date | Buyer | Sale Price | Title Company |
|---|---|---|---|
| Tweet Cheryl | -- | South Land Title Llc | |
| Collier Patrick | -- | South Land Title Llc |
Source: Public Records
Mortgage History
| Date | Status | Borrower | Loan Amount |
|---|---|---|---|
| Open | Tweet Cheryl | $359,910 |
Source: Public Records
Tax History Compared to Growth
Tax History
| Year | Tax Paid | Tax Assessment Tax Assessment Total Assessment is a certain percentage of the fair market value that is determined by local assessors to be the total taxable value of land and additions on the property. | Land | Improvement |
|---|---|---|---|---|
| 2025 | $5,803 | $601,440 | $134,740 | $466,700 |
| 2024 | $5,803 | $612,845 | -- | -- |
| 2023 | $5,803 | $557,132 | $0 | $0 |
| 2022 | $8,161 | $506,484 | $0 | $0 |
| 2021 | $8,032 | $555,180 | $41,100 | $514,080 |
| 2020 | $7,422 | $399,900 | $20,550 | $379,350 |
| 2019 | $7,107 | $365,220 | $20,550 | $344,670 |
| 2018 | $7,148 | $365,220 | $20,550 | $344,670 |
| 2017 | $7,144 | $365,220 | $20,550 | $344,670 |
| 2016 | $7,144 | $365,230 | $20,550 | $344,680 |
| 2015 | $7,097 | $357,390 | $12,710 | $344,680 |
| 2014 | $257 | $12,710 | $12,710 | $0 |
Source: Public Records
Map
Nearby Homes