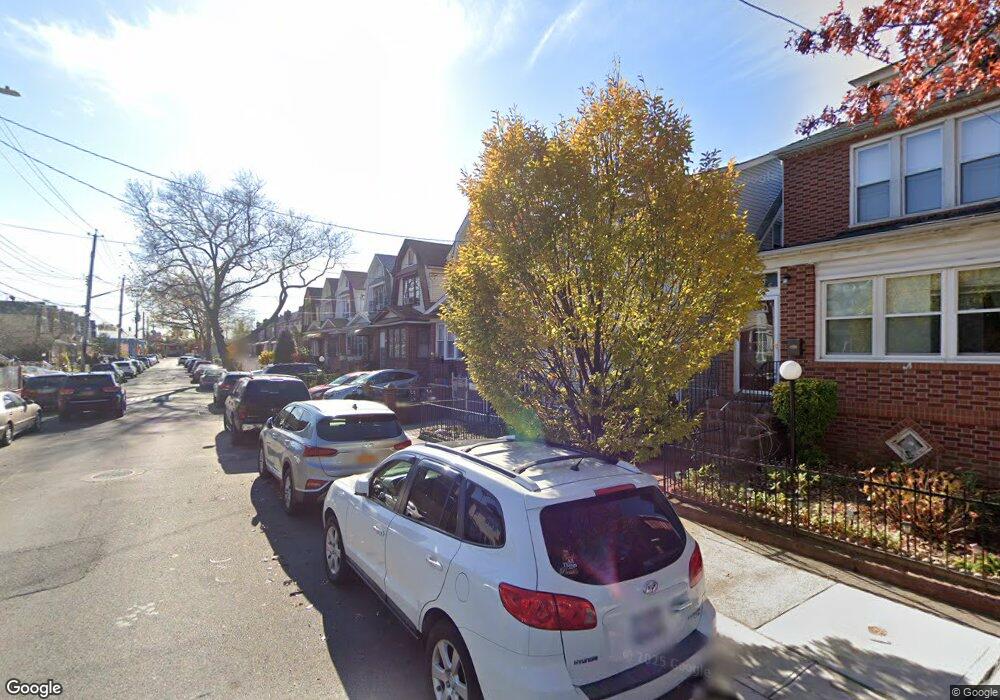
932 E 49th St Brooklyn, NY 11203
East Flatbush NeighborhoodEstimated Value: $651,327 - $792,000
Studio
--
Bath
1,520
Sq Ft
$460/Sq Ft
Est. Value
About This Home
This home is located at 932 E 49th St, Brooklyn, NY 11203 and is currently estimated at $699,082, approximately $459 per square foot. 932 E 49th St is a home located in Kings County with nearby schools including P.S. 208 Elsa Ebeling, I.S. 285 Meyer Levin, and Ivy Hill Preparatory Charter School.
Ownership History
Date
Name
Owned For
Owner Type
Purchase Details
Closed on
Jan 19, 2026
Sold by
Daniels Clifford and Daniels Sandra
Bought by
Daniels As Trustee Clifford and Daniels As Trustee Sandra
Current Estimated Value
Purchase Details
Closed on
Jan 30, 2007
Sold by
Webber Earl H and Webber Pattie
Bought by
Daniels Clifford and Daniels Sandra
Home Financials for this Owner
Home Financials are based on the most recent Mortgage that was taken out on this home.
Original Mortgage
$353,200
Interest Rate
6.33%
Mortgage Type
Purchase Money Mortgage
Create a Home Valuation Report for This Property
The Home Valuation Report is an in-depth analysis detailing your home's value as well as a comparison with similar homes in the area
Home Values in the Area
Average Home Value in this Area
Purchase History
| Date | Buyer | Sale Price | Title Company |
|---|---|---|---|
| Daniels As Trustee Clifford | -- | -- | |
| Daniels Clifford | $441,000 | -- | |
| Daniels Clifford | $441,000 | -- |
Source: Public Records
Mortgage History
| Date | Status | Borrower | Loan Amount |
|---|---|---|---|
| Previous Owner | Daniels Clifford | $353,200 | |
| Closed | Daniels Clifford | $88,300 |
Source: Public Records
Tax History
| Year | Tax Paid | Tax Assessment Tax Assessment Total Assessment is a certain percentage of the fair market value that is determined by local assessors to be the total taxable value of land and additions on the property. | Land | Improvement |
|---|---|---|---|---|
| 2025 | $5,763 | $39,720 | $12,720 | $27,000 |
| 2024 | $5,763 | $42,840 | $12,720 | $30,120 |
| 2023 | $5,498 | $41,940 | $12,720 | $29,220 |
| 2022 | $5,126 | $34,320 | $12,720 | $21,600 |
| 2021 | $5,404 | $37,200 | $12,720 | $24,480 |
| 2020 | $2,651 | $40,380 | $12,720 | $27,660 |
| 2019 | $5,002 | $40,380 | $12,720 | $27,660 |
| 2018 | $4,599 | $22,560 | $7,866 | $14,694 |
| 2017 | $4,362 | $21,398 | $10,404 | $10,994 |
| 2016 | $4,278 | $21,398 | $10,699 | $10,699 |
| 2015 | $2,435 | $21,120 | $12,216 | $8,904 |
| 2014 | $2,435 | $19,926 | $11,386 | $8,540 |
Source: Public Records
Map
Nearby Homes
Your Personal Tour Guide
Ask me questions while you tour the home.