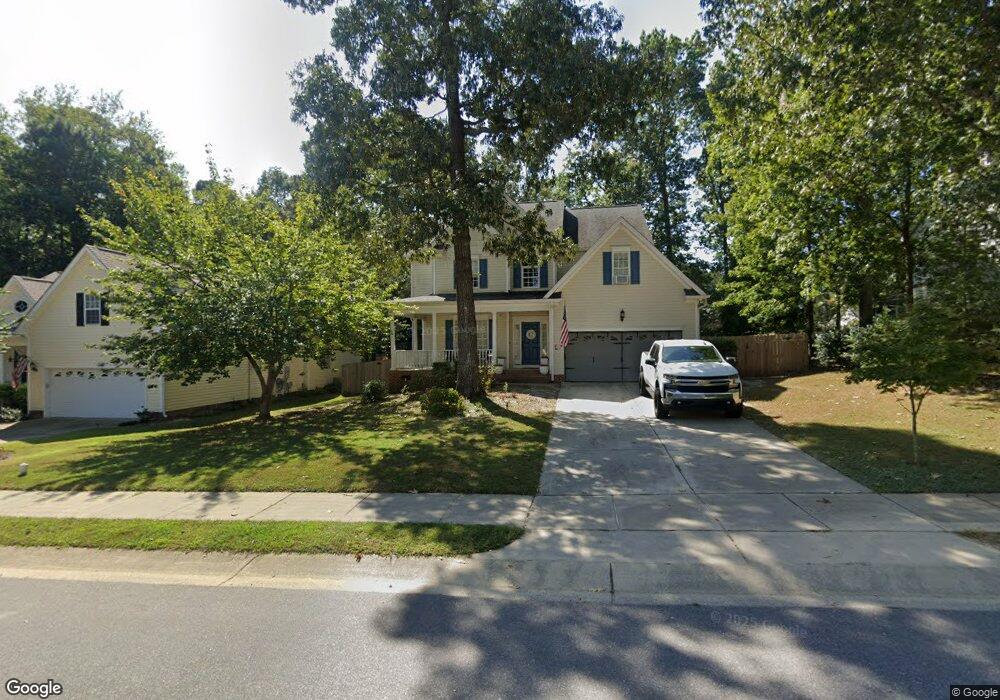
932 Glenmacie Dr Fuquay Varina, NC 27526
Estimated Value: $457,938 - $493,000
4
Beds
3
Baths
2,240
Sq Ft
$211/Sq Ft
Est. Value
About This Home
This home is located at 932 Glenmacie Dr, Fuquay Varina, NC 27526 and is currently estimated at $471,735, approximately $210 per square foot. 932 Glenmacie Dr is a home located in Wake County with nearby schools including Fuquay-Varina High and Southern Wake Academy.
Ownership History
Date
Name
Owned For
Owner Type
Purchase Details
Closed on
Nov 20, 2017
Sold by
Creekmore Robert T and Creekmore Yvonne L
Bought by
Kean Tyler D
Current Estimated Value
Home Financials for this Owner
Home Financials are based on the most recent Mortgage that was taken out on this home.
Original Mortgage
$210,000
Outstanding Balance
$176,109
Interest Rate
3.88%
Mortgage Type
New Conventional
Estimated Equity
$295,626
Purchase Details
Closed on
Jun 2, 2010
Sold by
Jones Brandon C and Jones Rebecca M
Bought by
Creekmore Robert T and Creekmore Yvonne L
Home Financials for this Owner
Home Financials are based on the most recent Mortgage that was taken out on this home.
Original Mortgage
$218,700
Interest Rate
5.03%
Mortgage Type
New Conventional
Purchase Details
Closed on
Feb 27, 2003
Sold by
Dutchman Builders Of Apex Inc
Bought by
Jones Brandon C and Jones Rebecca M
Home Financials for this Owner
Home Financials are based on the most recent Mortgage that was taken out on this home.
Original Mortgage
$161,120
Interest Rate
5.95%
Create a Home Valuation Report for This Property
The Home Valuation Report is an in-depth analysis detailing your home's value as well as a comparison with similar homes in the area
Home Values in the Area
Average Home Value in this Area
Purchase History
| Date | Buyer | Sale Price | Title Company |
|---|---|---|---|
| Kean Tyler D | $263,000 | None Available | |
| Creekmore Robert T | $243,000 | None Available | |
| Jones Brandon C | $202,000 | -- |
Source: Public Records
Mortgage History
| Date | Status | Borrower | Loan Amount |
|---|---|---|---|
| Open | Kean Tyler D | $210,000 | |
| Previous Owner | Creekmore Robert T | $218,700 | |
| Previous Owner | Jones Brandon C | $161,120 | |
| Closed | Jones Brandon C | $20,140 |
Source: Public Records
Tax History Compared to Growth
Tax History
| Year | Tax Paid | Tax Assessment Tax Assessment Total Assessment is a certain percentage of the fair market value that is determined by local assessors to be the total taxable value of land and additions on the property. | Land | Improvement |
|---|---|---|---|---|
| 2025 | $3,885 | $441,680 | $85,000 | $356,680 |
| 2024 | $3,869 | $441,680 | $85,000 | $356,680 |
| 2023 | $3,250 | $290,453 | $55,000 | $235,453 |
| 2022 | $3,054 | $290,453 | $55,000 | $235,453 |
| 2021 | $2,910 | $290,453 | $55,000 | $235,453 |
| 2020 | $2,910 | $290,453 | $55,000 | $235,453 |
| 2019 | $2,807 | $241,656 | $52,000 | $189,656 |
| 2018 | $2,647 | $241,656 | $52,000 | $189,656 |
| 2017 | $2,551 | $241,656 | $52,000 | $189,656 |
| 2016 | $2,516 | $241,656 | $52,000 | $189,656 |
| 2015 | $2,596 | $257,771 | $44,000 | $213,771 |
| 2014 | $2,502 | $257,771 | $44,000 | $213,771 |
Source: Public Records
Map
Nearby Homes
- 929 Lukestone Dr
- 926 Lukestone Dr
- 2117 Crockett Ridge Rd
- 1053 Lukestone Dr
- 2108 Woodwater Dr
- 1056 Lukestone Dr
- 820 E Cardinal Dr
- 0 E Cardinal Dr
- 2017 Rosebriar Ln
- 2328 Gathering Square Ct
- 2323 Gathering Square Ct
- 2321 Gathering Square Ct
- 2305 Gathering Square Ct
- 2327 Gathering Square Ct
- 2205 Gathering Square Ct
- 2225 Gathering Square Ct Unit 2225
- 2314 Gathering Square Ct
- 2300 Gathering Square Ct
- 2204 Gathering Square Ct
- 2202 Gathering Square Ct
- 928 Glenmacie Dr
- 936 Glenmacie Dr
- 917 Brookhannah Ct
- 913 Brookhannah Ct
- 924 Glenmacie Dr
- 953 Glenmacie Dr
- 909 Brookhannah Ct
- 949 Glenmacie Dr
- 957 Glenmacie Dr
- 920 Brookhannah Ct
- 961 Glenmacie Dr
- 920 Glenmacie Dr
- 945 Glenmacie Dr
- 1819 Shellview Dr
- 905 Brookhannah Ct
- 916 Brookhannah Ct
- 941 Glenmacie Dr
- 1822 Shellview Dr
- 916 Glenmacie Dr
- 908 Brookhannah Ct