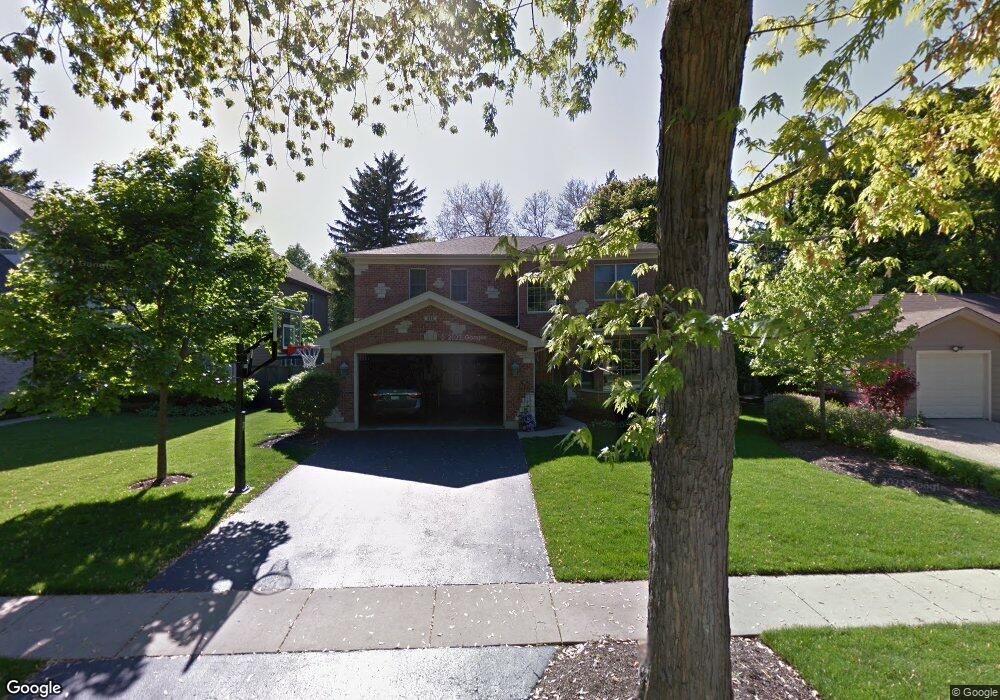
932 Hemlock St Deerfield, IL 60015
Estimated Value: $1,072,000 - $1,304,000
4
Beds
4
Baths
3,400
Sq Ft
$342/Sq Ft
Est. Value
About This Home
This home is located at 932 Hemlock St, Deerfield, IL 60015 and is currently estimated at $1,163,021, approximately $342 per square foot. 932 Hemlock St is a home located in Lake County with nearby schools including Wilmot Elementary School, Charles J Caruso Middle School, and Deerfield High School.
Ownership History
Date
Name
Owned For
Owner Type
Purchase Details
Closed on
Nov 2, 2000
Sold by
Clark Timothy R and Clark Christine M
Bought by
Mertes William A and Mertes Elizabeth K
Current Estimated Value
Home Financials for this Owner
Home Financials are based on the most recent Mortgage that was taken out on this home.
Original Mortgage
$197,600
Outstanding Balance
$72,760
Interest Rate
7.87%
Estimated Equity
$1,090,261
Purchase Details
Closed on
Oct 5, 1998
Sold by
Ehrens Ronald S and Ehrens Julie L
Bought by
Clark Timothy R and Clark Christine M
Home Financials for this Owner
Home Financials are based on the most recent Mortgage that was taken out on this home.
Original Mortgage
$194,750
Interest Rate
6.9%
Purchase Details
Closed on
Aug 18, 1994
Sold by
Bernero Frank J and Cramer June E
Bought by
Ehrens Ronald S and Ehrens Julie L
Home Financials for this Owner
Home Financials are based on the most recent Mortgage that was taken out on this home.
Original Mortgage
$171,600
Interest Rate
8.72%
Create a Home Valuation Report for This Property
The Home Valuation Report is an in-depth analysis detailing your home's value as well as a comparison with similar homes in the area
Home Values in the Area
Average Home Value in this Area
Purchase History
| Date | Buyer | Sale Price | Title Company |
|---|---|---|---|
| Mertes William A | $247,000 | -- | |
| Clark Timothy R | $205,000 | 1St American Title | |
| Ehrens Ronald S | $214,500 | Attys Natl Title |
Source: Public Records
Mortgage History
| Date | Status | Borrower | Loan Amount |
|---|---|---|---|
| Open | Mertes William A | $197,600 | |
| Previous Owner | Clark Timothy R | $194,750 | |
| Previous Owner | Ehrens Ronald S | $171,600 |
Source: Public Records
Tax History
| Year | Tax Paid | Tax Assessment Tax Assessment Total Assessment is a certain percentage of the fair market value that is determined by local assessors to be the total taxable value of land and additions on the property. | Land | Improvement |
|---|---|---|---|---|
| 2024 | $24,649 | $281,281 | $43,266 | $238,015 |
| 2023 | $24,649 | $269,943 | $41,522 | $228,421 |
| 2022 | $23,877 | $258,040 | $44,600 | $213,440 |
| 2021 | $22,533 | $248,785 | $43,000 | $205,785 |
| 2020 | $21,671 | $249,308 | $43,090 | $206,218 |
| 2019 | $25,263 | $295,854 | $43,017 | $252,837 |
| 2018 | $24,946 | $304,126 | $45,594 | $258,532 |
| 2017 | $24,746 | $303,156 | $45,449 | $257,707 |
| 2016 | $24,078 | $291,692 | $43,730 | $247,962 |
| 2015 | $23,613 | $274,069 | $41,088 | $232,981 |
| 2014 | $20,472 | $235,060 | $41,382 | $193,678 |
| 2012 | $19,962 | $232,986 | $41,017 | $191,969 |
Source: Public Records
Map
Nearby Homes
- 926 Cedar St
- 1302 Hazel Ave
- 1004 Broadmoor Place
- 1054 Broadmoor Place
- 1632 Village Green Ct
- 1625 Marcie Ct Unit 5
- 1030 Chestnut St
- 834 Chestnut St
- 826 Chestnut St
- 1165 Linden Ave
- 930 King Richards Ct
- 1335 Wilmot Rd
- 954 Osterman Ave
- 525 Mallard Ln
- 1420 Crowe Ave
- 1106 Waukegan Rd
- 950 Brookside Ln
- 1525 Hawthorne Place
- 1285 Warwick Ct
- 1285 Montgomery Dr
Your Personal Tour Guide
Ask me questions while you tour the home.