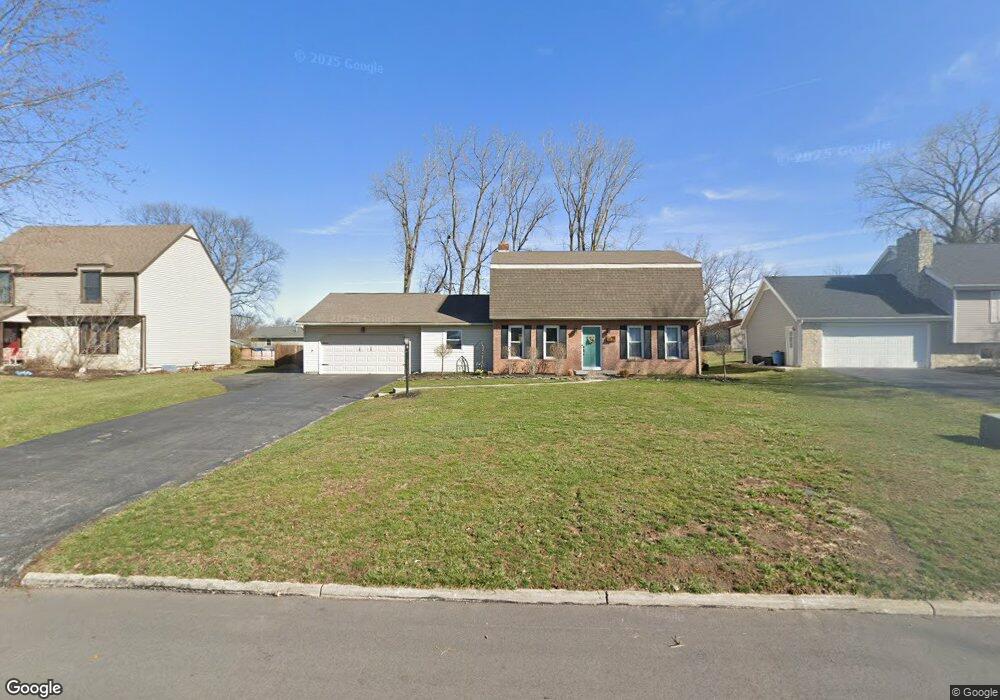
932 Laurel Ln Findlay, OH 45840
Estimated Value: $307,000 - $359,000
4
Beds
3
Baths
2,804
Sq Ft
$115/Sq Ft
Est. Value
About This Home
This home is located at 932 Laurel Ln, Findlay, OH 45840 and is currently estimated at $323,766, approximately $115 per square foot. 932 Laurel Ln is a home located in Hancock County with nearby schools including Bigelow Hill Elementary School, Northview Elementary School, and Glenwood Middle School.
Ownership History
Date
Name
Owned For
Owner Type
Purchase Details
Closed on
Nov 27, 2019
Sold by
Martin William A
Bought by
Smith Ryan M and Smith Valerie A
Current Estimated Value
Home Financials for this Owner
Home Financials are based on the most recent Mortgage that was taken out on this home.
Original Mortgage
$40,000
Outstanding Balance
$27,248
Interest Rate
3.75%
Mortgage Type
New Conventional
Estimated Equity
$296,518
Purchase Details
Closed on
Nov 20, 2015
Bought by
Martin William Arthur
Home Financials for this Owner
Home Financials are based on the most recent Mortgage that was taken out on this home.
Interest Rate
3.97%
Purchase Details
Closed on
Apr 18, 2000
Sold by
Kelly Larry L
Bought by
Martin Willliam A and Martin Elizabeth A
Home Financials for this Owner
Home Financials are based on the most recent Mortgage that was taken out on this home.
Original Mortgage
$135,850
Interest Rate
8.29%
Mortgage Type
New Conventional
Create a Home Valuation Report for This Property
The Home Valuation Report is an in-depth analysis detailing your home's value as well as a comparison with similar homes in the area
Home Values in the Area
Average Home Value in this Area
Purchase History
| Date | Buyer | Sale Price | Title Company |
|---|---|---|---|
| Smith Ryan M | $193,000 | Assured Title Agency | |
| Martin William Arthur | -- | -- | |
| Martin Willliam A | $143,000 | -- |
Source: Public Records
Mortgage History
| Date | Status | Borrower | Loan Amount |
|---|---|---|---|
| Open | Smith Ryan M | $40,000 | |
| Previous Owner | Martin William Arthur | -- | |
| Previous Owner | Martin Willliam A | $135,850 |
Source: Public Records
Tax History
| Year | Tax Paid | Tax Assessment Tax Assessment Total Assessment is a certain percentage of the fair market value that is determined by local assessors to be the total taxable value of land and additions on the property. | Land | Improvement |
|---|---|---|---|---|
| 2024 | $3,005 | $82,860 | $11,890 | $70,970 |
| 2023 | $3,010 | $82,860 | $11,890 | $70,970 |
| 2022 | $3,007 | $82,860 | $11,890 | $70,970 |
| 2021 | $2,723 | $65,450 | $11,890 | $53,560 |
| 2020 | $2,694 | $64,760 | $11,890 | $52,870 |
| 2019 | $2,825 | $64,760 | $11,890 | $52,870 |
| 2018 | $2,544 | $53,570 | $9,510 | $44,060 |
| 2017 | $2,329 | $53,570 | $9,510 | $44,060 |
| 2016 | $2,295 | $53,570 | $9,510 | $44,060 |
| 2015 | $2,703 | $61,810 | $9,510 | $52,300 |
| 2014 | $2,703 | $61,810 | $9,510 | $52,300 |
| 2012 | $2,721 | $61,810 | $9,510 | $52,300 |
Source: Public Records
Map
Nearby Homes
- 925 W Melrose Ave
- 2411 Villa W
- 3018 Gleneagle Dr
- 536 Edinborough Dr
- 724 Edith Ave
- 701 W Melrose Ave
- 3106 Saddlebrook
- 3237 Gleneagle Dr
- 2605 Eton Place
- 10321 Wheatfield Dr
- 400 Rosewood Ave
- 506 Hillcrest Ave
- 323 W Bigelow Ave
- 2318 Anna St
- 6535 Silver Lake Dr
- 3206 Turnberry Dr
- 3105 Crosshill Dr
- 3315 Crosshill Dr
- 2419 Hollybrook Dr
- 315 W Melrose Ave
- 924 Laurel Ln
- 940 Laurel Ln
- 931 Edgehill Rd
- 925 Edgehill Rd
- 939 Edgehill Rd
- 916 Laurel Ln
- 919 Edgehill Rd
- 2517 Northridge Rd
- 923 Laurel Ln
- 913 Edgehill Rd
- 2610 Northridge Rd
- 2620 Northridge Rd
- 2600 Northridge Rd
- 911 Laurel Ln
- 2630 Northridge Rd
- 2509 Northridge Rd
- 2520 Northridge Rd
- 907 Edgehill Rd
- 2700 Northridge Rd
- 900 Laurel Ln
Your Personal Tour Guide
Ask me questions while you tour the home.