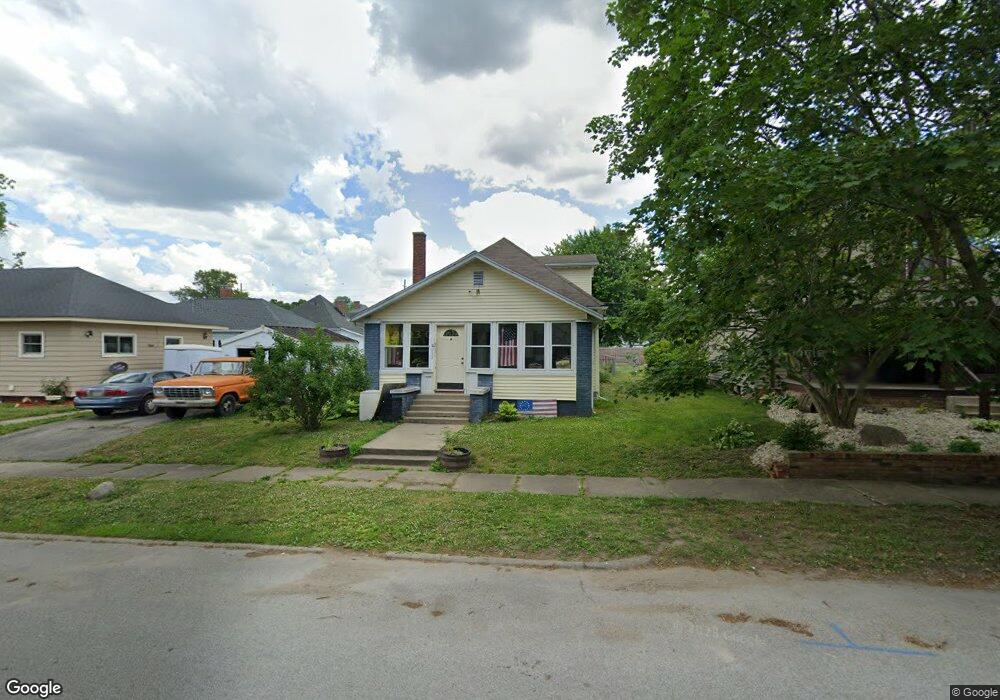
932 S 3rd St Clinton, IN 47842
Estimated Value: $120,000 - $136,000
3
Beds
2
Baths
1,252
Sq Ft
$102/Sq Ft
Est. Value
About This Home
This home is located at 932 S 3rd St, Clinton, IN 47842 and is currently estimated at $127,137, approximately $101 per square foot. 932 S 3rd St is a home located in Vermillion County with nearby schools including South Vermillion High School and Sacred Heart School.
Ownership History
Date
Name
Owned For
Owner Type
Purchase Details
Closed on
Feb 9, 2024
Sold by
Freeman Jesey E W and Freeman Alexis N
Bought by
Freeman Jesey and Freeman Amanda
Current Estimated Value
Home Financials for this Owner
Home Financials are based on the most recent Mortgage that was taken out on this home.
Original Mortgage
$71,459
Interest Rate
7.03%
Mortgage Type
FHA
Purchase Details
Closed on
Sep 9, 2016
Sold by
Bogetto Donald L
Bought by
Freeman Jesey E W and Freeman Alixis N
Create a Home Valuation Report for This Property
The Home Valuation Report is an in-depth analysis detailing your home's value as well as a comparison with similar homes in the area
Home Values in the Area
Average Home Value in this Area
Purchase History
| Date | Buyer | Sale Price | Title Company |
|---|---|---|---|
| Freeman Jesey | -- | Vylla Title | |
| Freeman Jesey E W | -- | -- |
Source: Public Records
Mortgage History
| Date | Status | Borrower | Loan Amount |
|---|---|---|---|
| Previous Owner | Freeman Jesey | $71,459 |
Source: Public Records
Tax History
| Year | Tax Paid | Tax Assessment Tax Assessment Total Assessment is a certain percentage of the fair market value that is determined by local assessors to be the total taxable value of land and additions on the property. | Land | Improvement |
|---|---|---|---|---|
| 2025 | $1,015 | $132,900 | $11,100 | $121,800 |
| 2024 | $1,015 | $101,500 | $11,100 | $90,400 |
| 2023 | $945 | $94,500 | $11,100 | $83,400 |
| 2022 | $950 | $94,600 | $11,100 | $83,500 |
| 2021 | $837 | $83,300 | $11,100 | $72,200 |
| 2020 | $743 | $73,900 | $14,400 | $59,500 |
| 2019 | $570 | $56,600 | $6,300 | $50,300 |
| 2018 | $570 | $56,600 | $6,300 | $50,300 |
| 2017 | $565 | $56,100 | $6,300 | $49,800 |
| 2016 | $436 | $54,500 | $6,300 | $48,200 |
| 2014 | $399 | $53,200 | $6,300 | $46,900 |
| 2013 | $399 | $53,200 | $6,300 | $46,900 |
Source: Public Records
Map
Nearby Homes
Your Personal Tour Guide
Ask me questions while you tour the home.