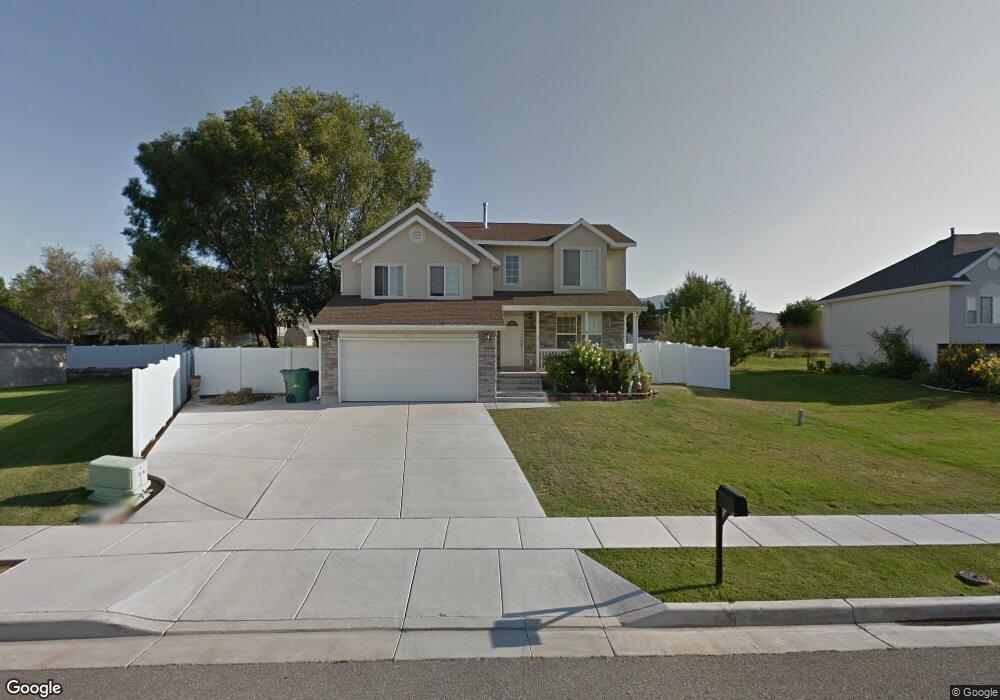
932 W 2275 N Layton, UT 84041
Estimated Value: $534,000 - $580,000
5
Beds
3
Baths
2,683
Sq Ft
$207/Sq Ft
Est. Value
About This Home
This home is located at 932 W 2275 N, Layton, UT 84041 and is currently estimated at $554,645, approximately $206 per square foot. 932 W 2275 N is a home located in Davis County with nearby schools including Lincoln Elementary School, North Layton Junior High School, and Northridge High School.
Ownership History
Date
Name
Owned For
Owner Type
Purchase Details
Closed on
Apr 10, 2017
Sold by
Johnson Charles and Johnson Deanna
Bought by
Johnson Charles W and Johnson Deanna L
Current Estimated Value
Home Financials for this Owner
Home Financials are based on the most recent Mortgage that was taken out on this home.
Original Mortgage
$276,000
Outstanding Balance
$228,427
Interest Rate
4.1%
Mortgage Type
VA
Estimated Equity
$326,218
Purchase Details
Closed on
Sep 24, 2012
Sold by
Rangel Yolanda and Rangel Jose E
Bought by
Johnson Charles and Johnson Deanna
Home Financials for this Owner
Home Financials are based on the most recent Mortgage that was taken out on this home.
Original Mortgage
$200,000
Interest Rate
3.63%
Mortgage Type
VA
Purchase Details
Closed on
Feb 11, 2000
Sold by
Gmw Development Inc
Bought by
Rangel Yolanda and Rangel Jose E
Home Financials for this Owner
Home Financials are based on the most recent Mortgage that was taken out on this home.
Original Mortgage
$183,447
Interest Rate
8.06%
Mortgage Type
VA
Create a Home Valuation Report for This Property
The Home Valuation Report is an in-depth analysis detailing your home's value as well as a comparison with similar homes in the area
Home Values in the Area
Average Home Value in this Area
Purchase History
| Date | Buyer | Sale Price | Title Company |
|---|---|---|---|
| Johnson Charles W | -- | -- | |
| Johnson Charles | -- | Founders Title Co L | |
| Rangel Yolanda | -- | Bonneville Title Company Inc |
Source: Public Records
Mortgage History
| Date | Status | Borrower | Loan Amount |
|---|---|---|---|
| Open | Johnson Charles W | $276,000 | |
| Closed | Johnson Charles | $200,000 | |
| Previous Owner | Rangel Yolanda | $183,447 |
Source: Public Records
Tax History Compared to Growth
Tax History
| Year | Tax Paid | Tax Assessment Tax Assessment Total Assessment is a certain percentage of the fair market value that is determined by local assessors to be the total taxable value of land and additions on the property. | Land | Improvement |
|---|---|---|---|---|
| 2025 | -- | $264,550 | $100,178 | $164,372 |
| 2024 | -- | $254,101 | $116,837 | $137,264 |
| 2023 | $557 | $450,000 | $139,920 | $310,080 |
| 2022 | $557 | $255,200 | $73,674 | $181,526 |
| 2021 | $14 | $353,000 | $102,544 | $250,456 |
| 2020 | $1,848 | $309,000 | $86,619 | $222,381 |
| 2019 | $1,848 | $295,000 | $82,576 | $212,424 |
| 2018 | $0 | $283,000 | $82,576 | $200,424 |
| 2016 | $1,773 | $130,241 | $26,164 | $104,077 |
| 2015 | $1,790 | $124,796 | $26,164 | $98,632 |
| 2014 | $1,857 | $132,399 | $26,164 | $106,235 |
| 2013 | -- | $110,396 | $26,884 | $83,512 |
Source: Public Records
Map
Nearby Homes
- 2298 N 1085 W
- 1155 W 2200 N
- 2149 N 750 W
- 2211 N 525 W
- 2248 N 500 W
- 506 W 2200 N
- 2233 N 475 W
- 2887 N 1175 W
- 538 W 1875 N
- 2949 N 1175 W
- 1070 S 1650 E
- 2875 N Hill Field Rd Unit 17
- 2875 N Hill Field Rd Unit 199
- 2875 N Hill Field Rd Unit 58
- 2875 N Hill Field Rd Unit 62
- 2875 N Hill Field Rd Unit 40
- 709 W Highway 193
- 865 S 1650 E Unit A
- 1660 E 900 S Unit 18
- 1094 N Angel St W
- 920 W 2275 N
- 968 Hidden Dr Unit 22
- 968 Hidden Dr
- 904 W 2275 N
- 941 W 2350 N
- 978 Hidden Dr Unit 23
- 978 Hidden Dr
- 921 W 2275 N
- 973 Hidden Dr Unit 20
- 973 Hidden Dr
- 921 W 2350 N
- 963 W 2350 N
- 958 W 2250 N Unit 21
- 985 Hidden Dr
- 958 2250 N Unit 21
- 985 Hidden Dr
- 985 Hidden Dr Unit 19
- 903 W 2275 N
- 957 W 2450 N
- 2259 N 900 W