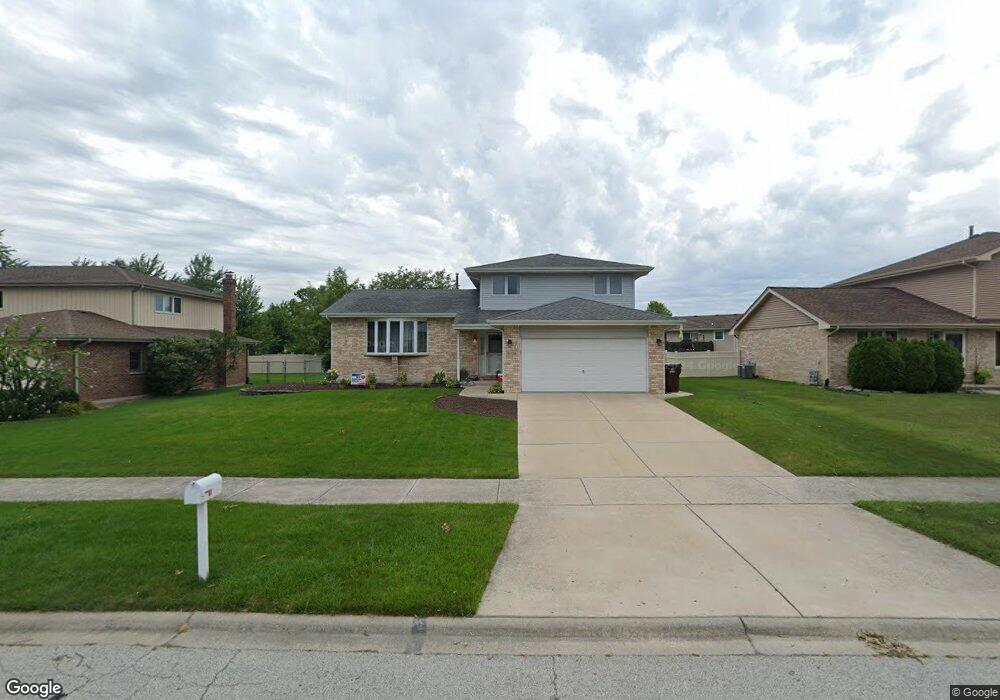
9320 Elm Ave Mokena, IL 60448
Arbury Hills NeighborhoodEstimated Value: $382,463 - $460,000
3
Beds
2
Baths
2,004
Sq Ft
$208/Sq Ft
Est. Value
About This Home
This home is located at 9320 Elm Ave, Mokena, IL 60448 and is currently estimated at $416,616, approximately $207 per square foot. 9320 Elm Ave is a home located in Will County with nearby schools including Arbury Hills Elementary School, Summit Hill Junior High School, and Lincoln-Way East High School.
Ownership History
Date
Name
Owned For
Owner Type
Purchase Details
Closed on
May 17, 2021
Sold by
First Midwest Bank
Bought by
Sonne Lindzay E and Sonne Zachary C
Current Estimated Value
Home Financials for this Owner
Home Financials are based on the most recent Mortgage that was taken out on this home.
Original Mortgage
$323,531
Outstanding Balance
$294,924
Interest Rate
3.62%
Mortgage Type
FHA
Estimated Equity
$121,692
Purchase Details
Closed on
May 20, 2009
Sold by
Pietruszynski Wayne and Pietruszynski Sandra
Bought by
Standard Bank & Trust Company and Trust #20576
Purchase Details
Closed on
Oct 14, 1994
Sold by
Castletown Homes Inc
Bought by
Pietruszynski Wayne and Pietruszynski Sandra
Home Financials for this Owner
Home Financials are based on the most recent Mortgage that was taken out on this home.
Original Mortgage
$124,800
Interest Rate
8.53%
Create a Home Valuation Report for This Property
The Home Valuation Report is an in-depth analysis detailing your home's value as well as a comparison with similar homes in the area
Home Values in the Area
Average Home Value in this Area
Purchase History
| Date | Buyer | Sale Price | Title Company |
|---|---|---|---|
| Sonne Lindzay E | $329,500 | None Available | |
| Standard Bank & Trust Company | -- | None Available | |
| Pietruszynski Wayne | $156,000 | Chicago Title Insurance Co |
Source: Public Records
Mortgage History
| Date | Status | Borrower | Loan Amount |
|---|---|---|---|
| Open | Sonne Lindzay E | $323,531 | |
| Previous Owner | Pietruszynski Wayne | $124,800 |
Source: Public Records
Tax History
| Year | Tax Paid | Tax Assessment Tax Assessment Total Assessment is a certain percentage of the fair market value that is determined by local assessors to be the total taxable value of land and additions on the property. | Land | Improvement |
|---|---|---|---|---|
| 2024 | $8,940 | $112,546 | $26,439 | $86,107 |
| 2023 | $8,940 | $100,515 | $23,613 | $76,902 |
| 2022 | $7,913 | $91,552 | $21,507 | $70,045 |
| 2021 | $7,235 | $85,651 | $20,121 | $65,530 |
| 2020 | $7,051 | $83,237 | $19,554 | $63,683 |
| 2019 | $6,810 | $81,010 | $19,031 | $61,979 |
| 2018 | $6,748 | $78,681 | $18,484 | $60,197 |
| 2017 | $6,599 | $76,845 | $18,053 | $58,792 |
| 2016 | $6,393 | $74,210 | $17,434 | $56,776 |
| 2015 | $6,144 | $71,597 | $16,820 | $54,777 |
| 2014 | $6,144 | $71,099 | $16,703 | $54,396 |
| 2013 | $6,144 | $72,021 | $16,920 | $55,101 |
Source: Public Records
Map
Nearby Homes
- 19416 Oak St
- 19632 Walnut St
- 19300 S La Grange Rd
- 19730 Kilkenny Ave
- 19503 Foxford Ln
- 19505 Foxford Ln
- 19507 Foxford Ln
- 8803 Willow Ln Unit MODEL
- 19415 Manchester Dr
- 19830 Mulroy Cir
- 19506 Waterford Ln
- 19501 Waterford Ln
- 19503 Waterford Ln
- 19458 Manchester Dr
- 19503 Tramore Ln
- 19060 Everett Blvd
- 19099 Hickory Creek Dr
- Lot 22 Hickory Creek Dr
- 9860 Stafford Ct
- 191 S 88th Ave
Your Personal Tour Guide
Ask me questions while you tour the home.