Estimated Value: $516,000 - $534,000
3
Beds
3
Baths
1,188
Sq Ft
$444/Sq Ft
Est. Value
About This Home
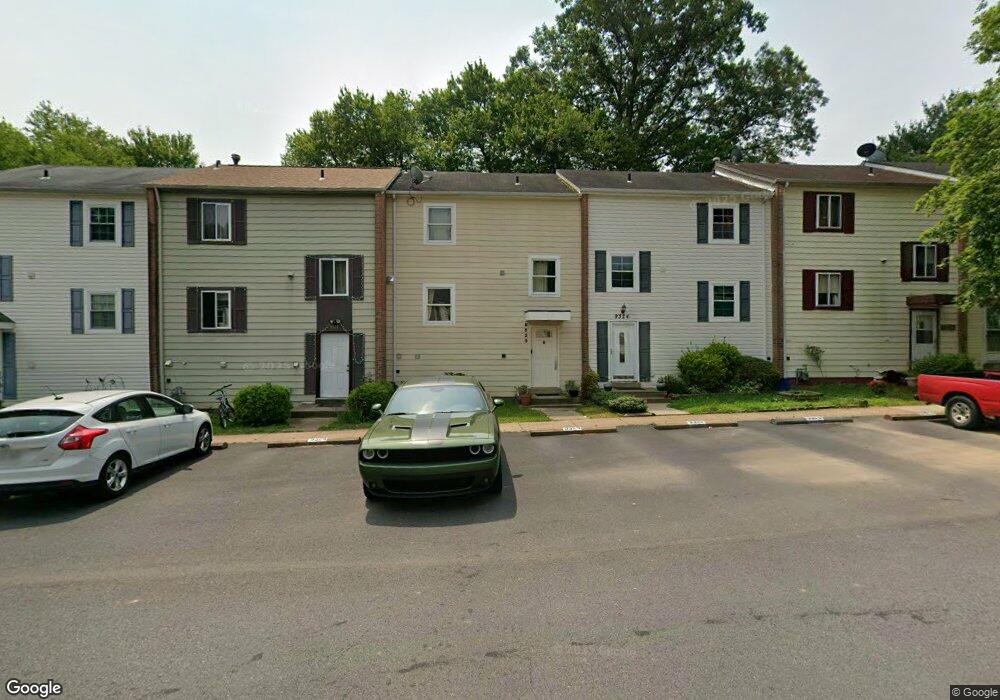
This home is located at 9322 Humphries Dr, Burke, VA 22015 and is currently estimated at $527,424, approximately $443 per square foot. 9322 Humphries Dr is a home located in Fairfax County with nearby schools including Little Run Elementary School, Lake Braddock Secondary School, and Holy Spirit School.
Ownership History
Date
Name
Owned For
Owner Type
Purchase Details
Closed on
Mar 21, 2005
Sold by
Gonzalez Hugo
Bought by
Garcia Danitza R
Current Estimated Value
Home Financials for this Owner
Home Financials are based on the most recent Mortgage that was taken out on this home.
Original Mortgage
$292,000
Outstanding Balance
$147,546
Interest Rate
5.56%
Mortgage Type
New Conventional
Estimated Equity
$379,878
Purchase Details
Closed on
Sep 25, 2003
Sold by
Azimi Badria
Bought by
Gonzalez Hugo
Home Financials for this Owner
Home Financials are based on the most recent Mortgage that was taken out on this home.
Original Mortgage
$230,000
Interest Rate
6.29%
Mortgage Type
New Conventional
Purchase Details
Closed on
Jul 10, 2003
Sold by
Miller Max G
Bought by
Azimi Badria
Purchase Details
Closed on
Nov 1, 1993
Sold by
Thompson D W
Bought by
Miller Max G
Home Financials for this Owner
Home Financials are based on the most recent Mortgage that was taken out on this home.
Original Mortgage
$107,100
Interest Rate
6.86%
Create a Home Valuation Report for This Property
The Home Valuation Report is an in-depth analysis detailing your home's value as well as a comparison with similar homes in the area
Home Values in the Area
Average Home Value in this Area
Purchase History
| Date | Buyer | Sale Price | Title Company |
|---|---|---|---|
| Garcia Danitza R | $365,000 | -- | |
| Gonzalez Hugo | $235,000 | -- | |
| Azimi Badria | $185,000 | -- | |
| Miller Max G | $119,000 | -- |
Source: Public Records
Mortgage History
| Date | Status | Borrower | Loan Amount |
|---|---|---|---|
| Open | Garcia Danitza R | $292,000 | |
| Previous Owner | Miller Max G | $230,000 | |
| Previous Owner | Miller Max G | $107,100 |
Source: Public Records
Tax History Compared to Growth
Tax History
| Year | Tax Paid | Tax Assessment Tax Assessment Total Assessment is a certain percentage of the fair market value that is determined by local assessors to be the total taxable value of land and additions on the property. | Land | Improvement |
|---|---|---|---|---|
| 2025 | $5,205 | $502,320 | $165,000 | $337,320 |
| 2024 | $5,205 | $449,330 | $145,000 | $304,330 |
| 2023 | $4,941 | $437,800 | $145,000 | $292,800 |
| 2022 | $4,589 | $401,340 | $130,000 | $271,340 |
| 2021 | $4,379 | $373,120 | $120,000 | $253,120 |
| 2020 | $4,279 | $361,520 | $115,000 | $246,520 |
| 2019 | $4,084 | $345,050 | $103,000 | $242,050 |
| 2018 | $3,934 | $342,050 | $100,000 | $242,050 |
| 2017 | $3,708 | $319,370 | $90,000 | $229,370 |
| 2016 | $3,626 | $313,000 | $90,000 | $223,000 |
| 2015 | $3,335 | $298,820 | $85,000 | $213,820 |
| 2014 | $3,159 | $283,670 | $75,000 | $208,670 |
Source: Public Records
Map
Nearby Homes
- 5055 Kenerson Dr
- 5039 Kenerson Dr
- 9438 Wallingford Dr
- 9370 Colbert Ct
- 5009 King David Blvd
- 9513 Burdett Rd
- 4947 Mcfarland Ct
- 4869 Nash Dr
- 5432 Brixham Ct
- 4906 Mcfarland Dr
- 9710 Ashbourn Dr
- 5137 Richardson Dr
- 9717 Commonwealth Blvd
- 5502 Saddlebrook Ct
- 5006 Lone Oak Place
- 9104 Parliament Dr
- 9662 Westport Ln
- 9883 Becket Ct
- 5608 Doolittle St
- 8909 Victoria Rd
- 9320 Humphries Dr
- 9324 Humphries Dr
- 9318 Humphries Dr
- 9326 Humphries Dr
- 9316 Humphries Dr
- 9328 Humphries Dr
- 5109 Harford Ln
- 5111 Harford Ln
- 9314 Humphries Dr
- 5108 Arrit Ct
- 5113 Harford Ln
- 9321 Humphries Dr
- 9323 Humphries Dr
- 9319 Humphries Dr
- 9317 Humphries Dr
- 9325 Humphries Dr
- 5106 Arrit Ct
- 9312 Humphries Dr
- 9315 Humphries Dr
- 9327 Humphries Dr