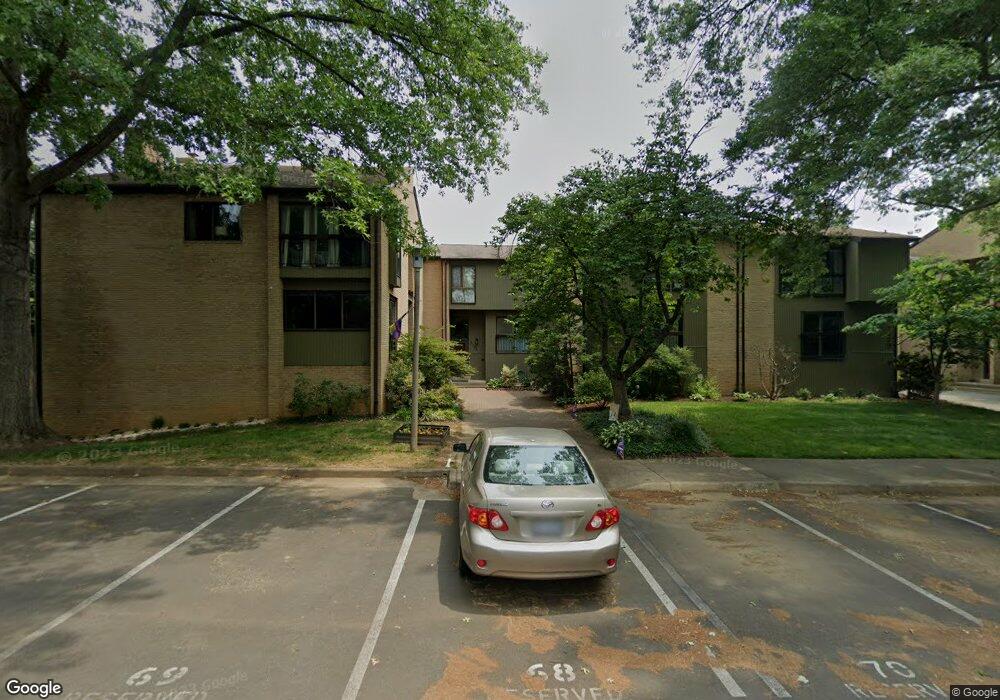
9323 Branch Side Ln Unit LN Fairfax, VA 22031
Estimated Value: $944,072 - $1,009,000
3
Beds
4
Baths
2,448
Sq Ft
$397/Sq Ft
Est. Value
About This Home
This home is located at 9323 Branch Side Ln Unit LN, Fairfax, VA 22031 and is currently estimated at $973,018, approximately $397 per square foot. 9323 Branch Side Ln Unit LN is a home located in Fairfax County with nearby schools including Marshall Road Elementary School, Thoreau Middle School, and Oakton High.
Ownership History
Date
Name
Owned For
Owner Type
Purchase Details
Closed on
Jul 22, 2021
Sold by
Lee John and Lee Jennifer
Bought by
Bhargava Neha and Bhargava Varsha
Current Estimated Value
Home Financials for this Owner
Home Financials are based on the most recent Mortgage that was taken out on this home.
Original Mortgage
$624,000
Outstanding Balance
$561,466
Interest Rate
2.37%
Mortgage Type
New Conventional
Estimated Equity
$411,552
Purchase Details
Closed on
Nov 6, 2003
Sold by
Lee Mon W
Bought by
Lee Jennifer
Home Financials for this Owner
Home Financials are based on the most recent Mortgage that was taken out on this home.
Original Mortgage
$240,000
Interest Rate
6.01%
Mortgage Type
New Conventional
Purchase Details
Closed on
Jun 27, 2000
Sold by
Pulte Home Corporation
Bought by
Lee Mon Wah
Home Financials for this Owner
Home Financials are based on the most recent Mortgage that was taken out on this home.
Original Mortgage
$138,000
Interest Rate
8.59%
Create a Home Valuation Report for This Property
The Home Valuation Report is an in-depth analysis detailing your home's value as well as a comparison with similar homes in the area
Home Values in the Area
Average Home Value in this Area
Purchase History
| Date | Buyer | Sale Price | Title Company |
|---|---|---|---|
| Bhargava Neha | $780,000 | Accommodation | |
| Lee Jennifer | $489,500 | -- | |
| Lee Mon Wah | $298,440 | -- |
Source: Public Records
Mortgage History
| Date | Status | Borrower | Loan Amount |
|---|---|---|---|
| Open | Bhargava Neha | $624,000 | |
| Previous Owner | Lee Jennifer | $240,000 | |
| Previous Owner | Lee Mon Wah | $138,000 |
Source: Public Records
Tax History Compared to Growth
Tax History
| Year | Tax Paid | Tax Assessment Tax Assessment Total Assessment is a certain percentage of the fair market value that is determined by local assessors to be the total taxable value of land and additions on the property. | Land | Improvement |
|---|---|---|---|---|
| 2025 | $9,028 | $853,910 | $270,000 | $583,910 |
| 2024 | $9,028 | $779,290 | $230,000 | $549,290 |
| 2023 | $8,494 | $752,680 | $225,000 | $527,680 |
| 2022 | $8,517 | $744,810 | $220,000 | $524,810 |
| 2021 | $8,345 | $711,100 | $210,000 | $501,100 |
| 2020 | $8,416 | $711,100 | $210,000 | $501,100 |
| 2019 | $8,120 | $686,140 | $190,000 | $496,140 |
| 2018 | $7,891 | $686,140 | $190,000 | $496,140 |
| 2017 | $7,966 | $686,140 | $190,000 | $496,140 |
| 2016 | $7,949 | $686,140 | $190,000 | $496,140 |
| 2015 | $8,035 | $719,950 | $190,000 | $529,950 |
| 2014 | $7,218 | $648,200 | $170,000 | $478,200 |
Source: Public Records
Map
Nearby Homes
- 2921 Deer Hollow Way Unit 214
- 2911 Deer Hollow Way Unit 118
- 2907 Bleeker St Unit 3-106
- 2959 Chesham St
- 9421 Canonbury Square
- 9523 Bastille St Unit 305
- 9521 Bastille St Unit 305
- 9521 Bastille St Unit 207
- 9521 Bastille St Unit 403
- 9652 Pullman Place
- 9324 Sweetbay Magnolia Ct
- 3161 Virginia Bluebell Ct
- 3094 Sassafras Ct
- 9151 Hermosa Dr
- 9337 Lemon Mint Ct
- 3028 White Birch Ct
- 3063 White Birch Ct
- 2960 Vaden Dr Unit 2-406
- 2960 Vaden Dr Unit 2-307
- 2960 Vaden Dr Unit 2-103
- 9323 Branch Side Ln
- 9321 Branch Side Ln
- 9325 Branch Side Ln
- 9319 Branch Side Ln
- 9319 Branch Side Ln Unit LN
- 9331 Branch Side Ln
- 9317 Branch Side Ln
- 9317 Branchside Ln
- 2961 Hunters Branch Rd
- 2959 Hunters Branch Rd
- 9333 Branch Side Ln
- 2957 Hunters Branch Rd
- 9324 Branch Side Ln
- 9322 Branch Side Ln
- 9322 Branchside Ln
- 9320 Branch Side Ln
- 9326 Branch Side Ln
- 2955 Hunters Branch Rd
- 9335 Branch Side Ln
- 9318 Branch Side Ln