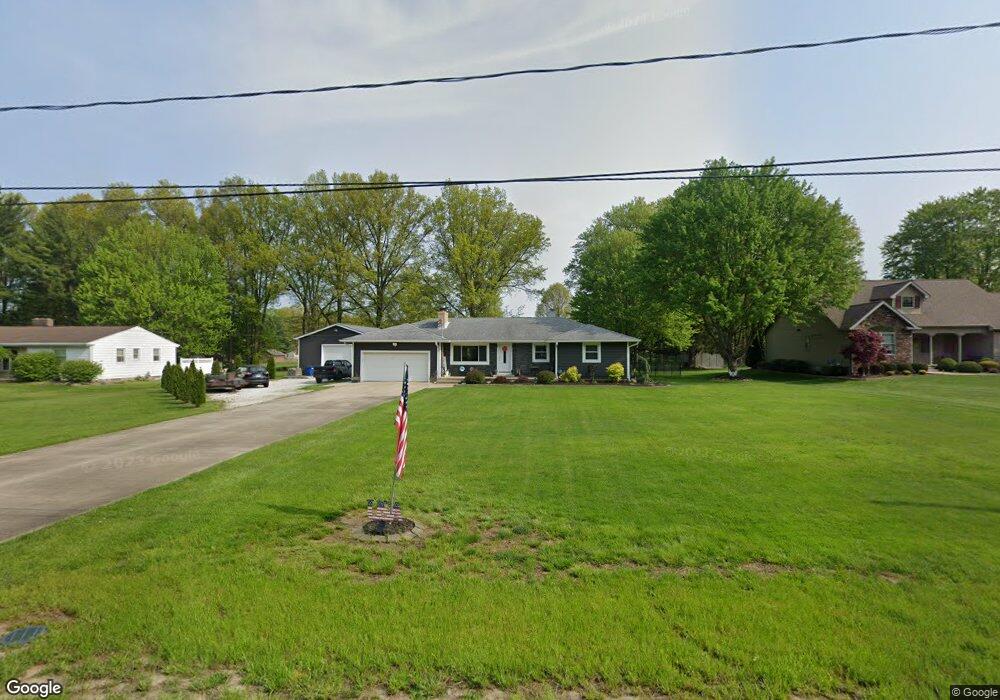
9323 Sunview Dr NE Warren, OH 44484
Estimated Value: $217,000 - $289,000
3
Beds
1
Bath
1,405
Sq Ft
$177/Sq Ft
Est. Value
About This Home
This home is located at 9323 Sunview Dr NE, Warren, OH 44484 and is currently estimated at $249,233, approximately $177 per square foot. 9323 Sunview Dr NE is a home located in Trumbull County with nearby schools including Howland High School.
Ownership History
Date
Name
Owned For
Owner Type
Purchase Details
Closed on
Aug 16, 2017
Sold by
Hamilton Lynda K
Bought by
Siefert Keith E and Siefert Tami S
Current Estimated Value
Home Financials for this Owner
Home Financials are based on the most recent Mortgage that was taken out on this home.
Original Mortgage
$85,000
Outstanding Balance
$70,849
Interest Rate
3.92%
Mortgage Type
New Conventional
Estimated Equity
$178,384
Purchase Details
Closed on
Aug 13, 2004
Sold by
Stankewich Frank
Bought by
Hamilton Richard A and Hamilton Lynda K
Purchase Details
Closed on
Apr 13, 1994
Sold by
Stankewich Frank G
Bought by
Frank G Stankewich Tr Ann D Stankewich T
Purchase Details
Closed on
Jan 1, 1990
Bought by
Frank G Stankewich
Create a Home Valuation Report for This Property
The Home Valuation Report is an in-depth analysis detailing your home's value as well as a comparison with similar homes in the area
Home Values in the Area
Average Home Value in this Area
Purchase History
| Date | Buyer | Sale Price | Title Company |
|---|---|---|---|
| Siefert Keith E | $120,000 | None Available | |
| Hamilton Richard A | $125,000 | -- | |
| Hamilton Richard A | $125,000 | -- | |
| Frank G Stankewich Tr Ann D Stankewich T | -- | -- | |
| Frank G Stankewich | -- | -- |
Source: Public Records
Mortgage History
| Date | Status | Borrower | Loan Amount |
|---|---|---|---|
| Open | Siefert Keith E | $85,000 | |
| Closed | Hamilton Richard A | -- |
Source: Public Records
Tax History Compared to Growth
Tax History
| Year | Tax Paid | Tax Assessment Tax Assessment Total Assessment is a certain percentage of the fair market value that is determined by local assessors to be the total taxable value of land and additions on the property. | Land | Improvement |
|---|---|---|---|---|
| 2024 | $3,538 | $65,320 | $16,420 | $48,900 |
| 2023 | $3,538 | $65,320 | $16,420 | $48,900 |
| 2022 | $2,858 | $44,420 | $16,420 | $28,000 |
| 2021 | $2,793 | $44,420 | $16,420 | $28,000 |
| 2020 | $2,804 | $44,420 | $16,420 | $28,000 |
| 2019 | $2,791 | $41,870 | $16,420 | $25,450 |
| 2018 | $2,348 | $36,790 | $16,420 | $20,370 |
| 2017 | $2,060 | $36,790 | $16,420 | $20,370 |
| 2016 | $2,139 | $37,140 | $16,420 | $20,720 |
| 2015 | $2,086 | $37,140 | $16,420 | $20,720 |
| 2014 | $2,013 | $37,140 | $16,420 | $20,720 |
| 2013 | $2,001 | $37,140 | $16,420 | $20,720 |
Source: Public Records
Map
Nearby Homes
- 2193 Howland Wilson Rd NE
- 1750 Portal Dr NE
- 1015 Cambridge Ct NE
- 8848 King Graves Rd NE
- 9550 Hunt Club Trail NE
- 8545 Carriage Hill Dr NE
- 2133 Silver Fox Ln NE
- 8531 Red Oak Dr NE
- 2158 Celestial Dr NE
- 2212 Celestial Dr NE
- 0 Palette Dr NE Unit 5010848
- 0 King Graves Rd NE
- 5 Oh-46
- 4 Niles Cortland Rd NE
- 0 #3 Niles Cortland Rd- Sr 46 Unit 4274646
- 1 Oh-46
- 0 Niles Cortland Rd Sr 46 Unit 4273262
- Lot 4 N Gulch Ln
- 2329 Henn Hyde Rd NE
- 0 Muir Woods Dr
- 9349 Sunview Dr NE
- 9297 Sunview Dr NE
- 9375 Sunview Dr NE
- 9277 Sunview Dr NE
- 9267 Sunview Dr NE
- 9330 Sunview Dr NE
- 9296 Sunview Dr NE
- 9247 Sunview Dr NE
- 2029 Howland Wilson Rd NE
- 9276 Sunview Dr NE
- 2133 Howland Wilson Rd NE
- 9292 Hillview Dr NE
- 9302 Hillview Dr NE
- 2153 Howland Wilson Rd NE
- 2009 Howland Wilson Rd NE
- 9272 Hillview Dr NE
- 2173 Howland Wilson Rd NE
- 9246 Sunview Dr NE
- 9227 Sunview Dr NE
- 9252 Hillview Dr NE