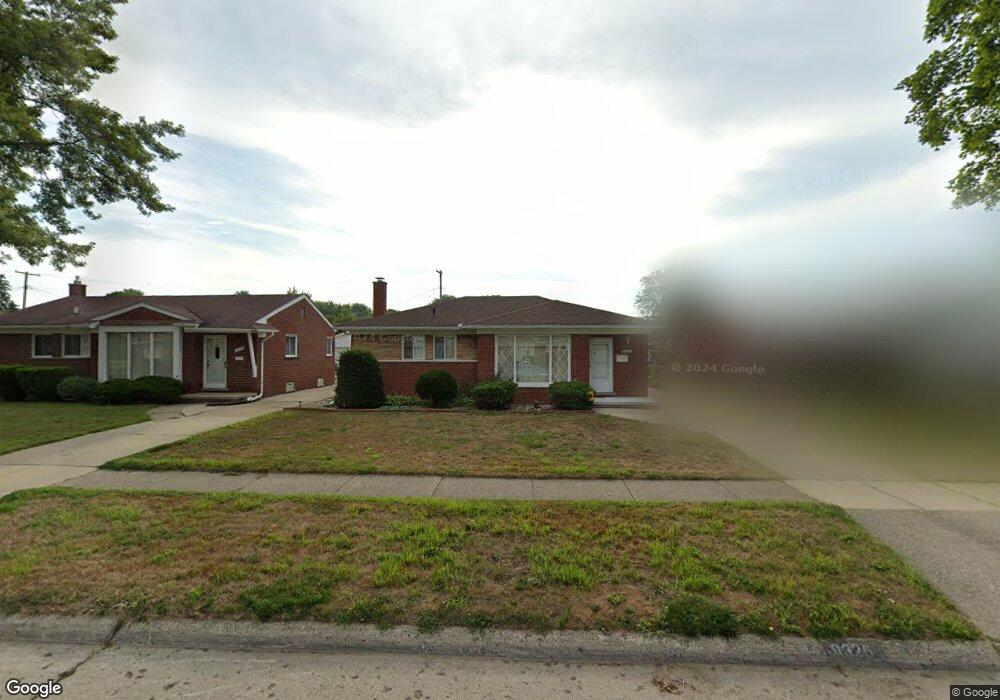
9326 Riverview Redford, MI 48239
Estimated Value: $175,563 - $206,000
Studio
1
Bath
1,013
Sq Ft
$186/Sq Ft
Est. Value
About This Home
This home is located at 9326 Riverview, Redford, MI 48239 and is currently estimated at $188,641, approximately $186 per square foot. 9326 Riverview is a home located in Wayne County with nearby schools including John D. Pierce Middle School, Lee M. Thurston High School, and Global Heights Academy.
Ownership History
Date
Name
Owned For
Owner Type
Purchase Details
Closed on
Sep 21, 2007
Sold by
Small Milton
Bought by
Small Shandel Latrice
Current Estimated Value
Home Financials for this Owner
Home Financials are based on the most recent Mortgage that was taken out on this home.
Original Mortgage
$150,000
Interest Rate
6.55%
Mortgage Type
Purchase Money Mortgage
Purchase Details
Closed on
Dec 26, 1996
Sold by
Beverly A Binkley and Beverly Juli
Bought by
Small Shandel Brown and Small Milton
Create a Home Valuation Report for This Property
The Home Valuation Report is an in-depth analysis detailing your home's value as well as a comparison with similar homes in the area
Home Values in the Area
Average Home Value in this Area
Purchase History
| Date | Buyer | Sale Price | Title Company |
|---|---|---|---|
| Small Shandel Latrice | -- | Chirco Title Company | |
| Small Shandel Brown | $85,000 | -- |
Source: Public Records
Mortgage History
| Date | Status | Borrower | Loan Amount |
|---|---|---|---|
| Closed | Small Shandel Latrice | $150,000 |
Source: Public Records
Tax History
| Year | Tax Paid | Tax Assessment Tax Assessment Total Assessment is a certain percentage of the fair market value that is determined by local assessors to be the total taxable value of land and additions on the property. | Land | Improvement |
|---|---|---|---|---|
| 2025 | $670 | $82,300 | $0 | $0 |
| 2024 | $652 | $73,300 | $0 | $0 |
| 2023 | $624 | $63,300 | $0 | $0 |
| 2022 | $1,866 | $54,000 | $0 | $0 |
| 2021 | $1,813 | $51,800 | $0 | $0 |
| 2020 | $1,789 | $46,700 | $0 | $0 |
| 2019 | $1,751 | $35,700 | $0 | $0 |
| 2018 | $562 | $29,500 | $0 | $0 |
| 2017 | $1,944 | $27,200 | $0 | $0 |
| 2016 | $1,515 | $25,300 | $0 | $0 |
| 2015 | $2,360 | $23,600 | $0 | $0 |
| 2013 | $2,450 | $25,000 | $0 | $0 |
| 2012 | $1,578 | $27,600 | $6,900 | $20,700 |
Source: Public Records
Map
Nearby Homes