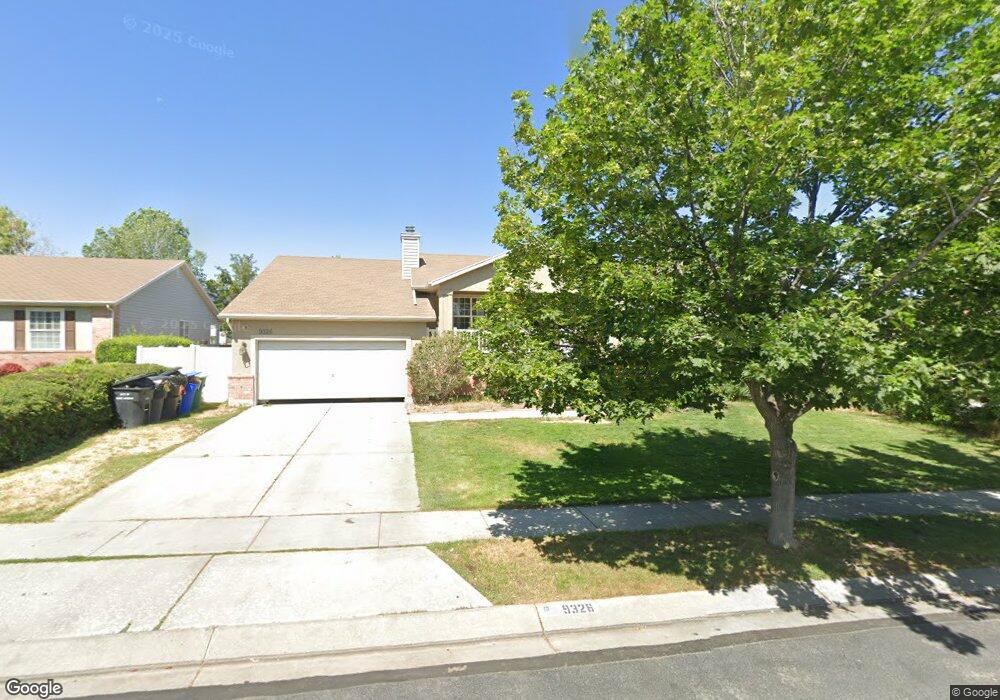
9326 S Uinta Hills Dr West Jordan, UT 84088
Jordan Oaks NeighborhoodEstimated Value: $631,000 - $708,000
6
Beds
3
Baths
3,050
Sq Ft
$216/Sq Ft
Est. Value
About This Home
This home is located at 9326 S Uinta Hills Dr, West Jordan, UT 84088 and is currently estimated at $657,608, approximately $215 per square foot. 9326 S Uinta Hills Dr is a home located in Salt Lake County with nearby schools including Terra Linda Elementary School, Elk Ridge Middle School, and Itineris Early College High School.
Ownership History
Date
Name
Owned For
Owner Type
Purchase Details
Closed on
Nov 26, 2013
Sold by
Hansen Kirsi P and Hansen Jon B
Bought by
Kemp Paul
Current Estimated Value
Home Financials for this Owner
Home Financials are based on the most recent Mortgage that was taken out on this home.
Original Mortgage
$133,000
Outstanding Balance
$99,291
Interest Rate
4.18%
Mortgage Type
New Conventional
Estimated Equity
$558,317
Purchase Details
Closed on
Aug 3, 2010
Sold by
Hansen Jon B and Hansen Kirsi P
Bought by
Hansen Kirsi P and Hansen Jon B
Home Financials for this Owner
Home Financials are based on the most recent Mortgage that was taken out on this home.
Original Mortgage
$168,800
Interest Rate
4.65%
Mortgage Type
New Conventional
Purchase Details
Closed on
Sep 26, 1996
Sold by
Pulte Home Corp
Bought by
Hansen Jon B and Hansen Kirsi P
Home Financials for this Owner
Home Financials are based on the most recent Mortgage that was taken out on this home.
Original Mortgage
$135,950
Interest Rate
7.87%
Mortgage Type
FHA
Create a Home Valuation Report for This Property
The Home Valuation Report is an in-depth analysis detailing your home's value as well as a comparison with similar homes in the area
Home Values in the Area
Average Home Value in this Area
Purchase History
| Date | Buyer | Sale Price | Title Company |
|---|---|---|---|
| Kemp Paul | -- | Meridian Title | |
| Hansen Kirsi P | -- | First American Title | |
| Hansen Jon B | -- | -- |
Source: Public Records
Mortgage History
| Date | Status | Borrower | Loan Amount |
|---|---|---|---|
| Open | Kemp Paul | $133,000 | |
| Previous Owner | Hansen Kirsi P | $168,800 | |
| Previous Owner | Hansen Jon B | $135,950 |
Source: Public Records
Tax History Compared to Growth
Tax History
| Year | Tax Paid | Tax Assessment Tax Assessment Total Assessment is a certain percentage of the fair market value that is determined by local assessors to be the total taxable value of land and additions on the property. | Land | Improvement |
|---|---|---|---|---|
| 2025 | $3,042 | $604,200 | $172,100 | $432,100 |
| 2024 | $3,042 | $585,300 | $166,500 | $418,800 |
| 2023 | $3,089 | $560,200 | $163,200 | $397,000 |
| 2022 | $3,202 | $571,300 | $160,000 | $411,300 |
| 2021 | $2,687 | $436,300 | $120,000 | $316,300 |
| 2020 | $2,480 | $378,000 | $108,000 | $270,000 |
| 2019 | $2,500 | $373,600 | $108,000 | $265,600 |
| 2018 | $2,352 | $348,700 | $107,000 | $241,700 |
| 2017 | $2,205 | $325,400 | $107,000 | $218,400 |
| 2016 | $2,210 | $306,400 | $107,000 | $199,400 |
| 2015 | $2,191 | $296,200 | $122,000 | $174,200 |
| 2014 | $2,100 | $279,500 | $116,300 | $163,200 |
Source: Public Records
Map
Nearby Homes
- 9353 S 4460 W
- 9375 S Laurel Ridge Cir
- 9029 S Ripple Dr
- 4565 Lennox Dr
- 4424 W Skye Dr
- 8941 S Sun Leaf Dr
- 4707 W Granada Hills Ct
- 4624 Pine Crossing Dr
- 9851 S Birdie Way
- 3750 W Bingham Creek Dr
- 4904 Wild Acres Dr
- 3702 W Angus Dr
- 9871 S 4000 W
- 9332 S Wild Clover Ln
- 3931 W Dansere Cir
- 9441 S Newkirk St
- 4554 Birdie Way
- 3965 Dundee St
- 9941 Birnam Woods Way
- 3888 W 8700 S
- 9326 Uinta Hills Dr
- 9312 Uinta Hills Dr
- 9312 S Uinta Hills Dr
- 9338 S Uinta Hills Dr
- 9338 Uinta Hills Dr
- 9329 Welby Hills Dr
- 9315 Welby Hills Dr
- 9343 S Welby Hills Dr
- 9343 Welby Hills Dr
- 9327 Uinta Hills Dr
- 9327 S Uinta Hills Dr
- 9352 Uinta Hills Dr
- 9298 S Uinta Hills Dr
- 9298 Uinta Hills Dr
- 9313 Uinta Hills Dr
- 9313 S Uinta Hills Dr
- 9341 Uinta Hills Dr
- 9341 S Uinta Hills Dr
- 9301 Welby Hills Dr
- 9301 S Welby Hills Dr