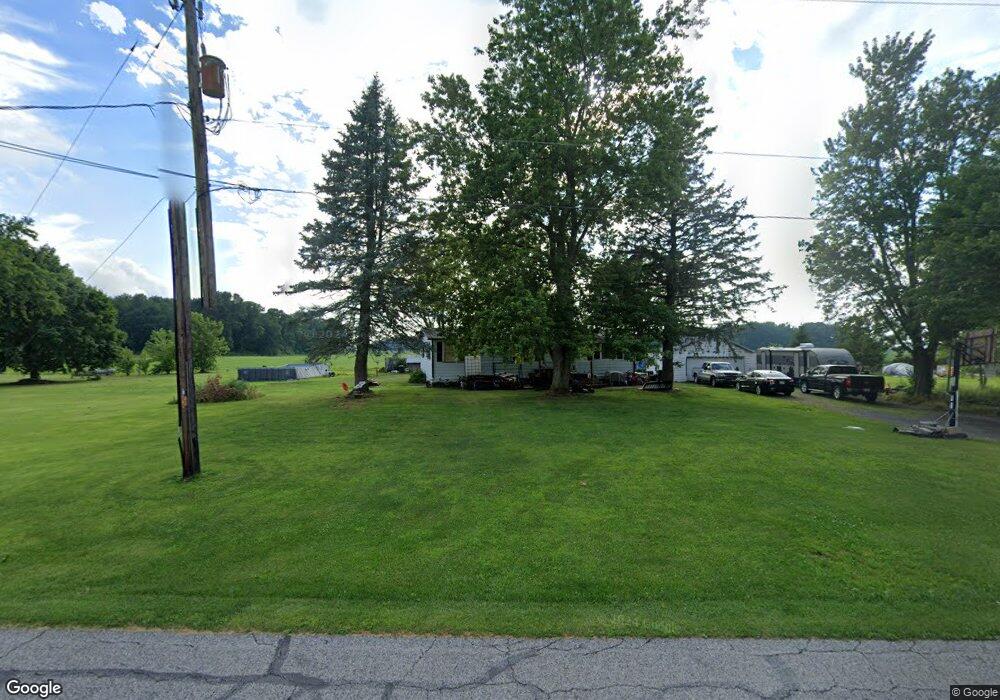
9327 County Road 16 Wauseon, OH 43567
Estimated Value: $130,000 - $189,000
3
Beds
2
Baths
1,152
Sq Ft
$137/Sq Ft
Est. Value
About This Home
This home is located at 9327 County Road 16, Wauseon, OH 43567 and is currently estimated at $157,985, approximately $137 per square foot. 9327 County Road 16 is a home located in Fulton County with nearby schools including Wauseon Primary School, Wauseon Elementary School, and Wauseon Middle School.
Ownership History
Date
Name
Owned For
Owner Type
Purchase Details
Closed on
Aug 3, 2021
Sold by
Howe Diane L and Howe James R
Bought by
Schmidt Richard and Schmidt Cindy
Current Estimated Value
Purchase Details
Closed on
Mar 12, 2013
Sold by
Wainright Johnathon
Bought by
Howe Diane L and Howe James R
Purchase Details
Closed on
Mar 6, 2013
Sold by
Wainwright Jessica
Bought by
Howe Diane L and Howe James R
Purchase Details
Closed on
May 23, 2012
Sold by
Howe Diane L and Howe James R
Bought by
Wainwright Johnathon and Wainwright Jessica
Purchase Details
Closed on
May 11, 2011
Sold by
Estate Of Leroy L Tennant
Bought by
Howe Diane L
Purchase Details
Closed on
Feb 17, 2011
Sold by
Estate Of Lois D Tennant
Bought by
Tennant Leroy L
Purchase Details
Closed on
Jan 1, 1990
Bought by
Tennant Leroy and Tennant Lois
Create a Home Valuation Report for This Property
The Home Valuation Report is an in-depth analysis detailing your home's value as well as a comparison with similar homes in the area
Home Values in the Area
Average Home Value in this Area
Purchase History
| Date | Buyer | Sale Price | Title Company |
|---|---|---|---|
| Schmidt Richard | -- | None Available | |
| Howe Diane L | -- | Attorney | |
| Howe Diane L | -- | Attorney | |
| Wainwright Johnathon | $65,000 | Attorney | |
| Howe Diane L | -- | None Available | |
| Tennant Leroy L | -- | None Available | |
| Tennant Leroy | -- | -- |
Source: Public Records
Mortgage History
| Date | Status | Borrower | Loan Amount |
|---|---|---|---|
| Closed | Wainwright Johnathon | $0 |
Source: Public Records
Tax History Compared to Growth
Tax History
| Year | Tax Paid | Tax Assessment Tax Assessment Total Assessment is a certain percentage of the fair market value that is determined by local assessors to be the total taxable value of land and additions on the property. | Land | Improvement |
|---|---|---|---|---|
| 2024 | $1,406 | $30,660 | $9,240 | $21,420 |
| 2023 | $1,406 | $30,660 | $9,240 | $21,420 |
| 2022 | $1,295 | $24,190 | $7,700 | $16,490 |
| 2021 | $1,459 | $24,190 | $7,700 | $16,490 |
| 2020 | $1,296 | $24,190 | $7,700 | $16,490 |
| 2019 | $1,210 | $22,400 | $7,560 | $14,840 |
| 2018 | $589 | $22,400 | $7,560 | $14,840 |
| 2017 | $1,200 | $22,400 | $7,560 | $14,840 |
| 2016 | $1,121 | $21,040 | $7,560 | $13,480 |
| 2015 | $1,047 | $21,040 | $7,560 | $13,480 |
| 2014 | $1,063 | $21,040 | $7,560 | $13,480 |
| 2013 | $1,172 | $21,780 | $7,460 | $14,320 |
Source: Public Records
Map
Nearby Homes
- 473 Windisch St
- 14900 W Co Rd H
- 14900 County Road H
- 11670 County Road L
- 14578 Us Highway 20a
- 1338 N Park Ln
- 460 Airport Hwy
- 1270 S Park Ln
- 8453 County Road 13
- 0 County Road H
- 16034 County Road F
- 13354 U S 20a
- 13242 Us Highway 20a
- 227 Wabash St
- 1209 Apache Dr
- 801 N Shoop Ave
- 428 N Brunell St
- 204 Jefferson St
- 351 E Walnut St
- 16099 Us Highway 20
- 9365 County Road 16
- 9300 County Road 16
- 9271 County Road 16
- 9340 County Road 16
- 9370 County Road 16
- 9243 County Road 16
- 9410 County Road 16
- 9260 County Road 16
- V635 State Route 108
- 9456 County Road 16
- 9480 County Road 16
- 8984 County Road 16
- 12509 County Road J
- 11101 County Road J
- 0 County Road J
- 16256 County Road J
- 15742 County Road J
- 16199 County Road J
- 15765 County Road J
- 9728 County Road 16