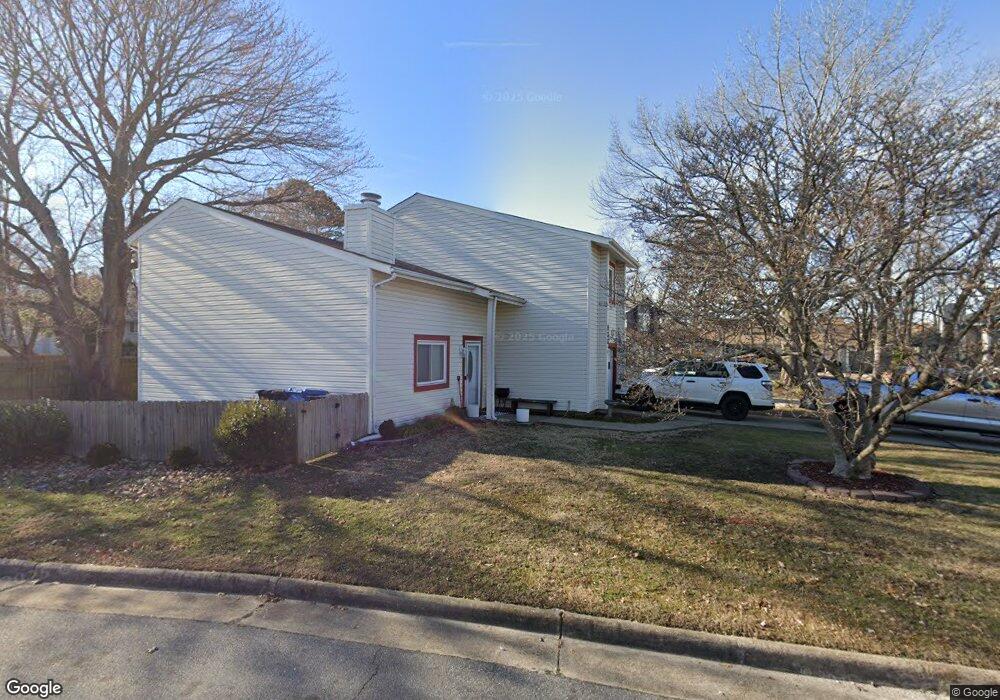
933 Appleby Ct Virginia Beach, VA 23462
Green Run NeighborhoodEstimated Value: $359,000 - $415,000
4
Beds
3
Baths
1,800
Sq Ft
$212/Sq Ft
Est. Value
About This Home
This home is located at 933 Appleby Ct, Virginia Beach, VA 23462 and is currently estimated at $381,199, approximately $211 per square foot. 933 Appleby Ct is a home located in Virginia Beach City with nearby schools including White Oaks Elementary School, Larkspur Middle School, and Green Run High School.
Ownership History
Date
Name
Owned For
Owner Type
Purchase Details
Closed on
Jun 25, 2004
Sold by
Molloy John E
Bought by
Messick Robert E
Current Estimated Value
Home Financials for this Owner
Home Financials are based on the most recent Mortgage that was taken out on this home.
Original Mortgage
$161,987
Outstanding Balance
$80,774
Interest Rate
6.3%
Mortgage Type
VA
Estimated Equity
$300,425
Create a Home Valuation Report for This Property
The Home Valuation Report is an in-depth analysis detailing your home's value as well as a comparison with similar homes in the area
Home Values in the Area
Average Home Value in this Area
Purchase History
| Date | Buyer | Sale Price | Title Company |
|---|---|---|---|
| Messick Robert E | $158,500 | -- |
Source: Public Records
Mortgage History
| Date | Status | Borrower | Loan Amount |
|---|---|---|---|
| Open | Messick Robert E | $161,987 |
Source: Public Records
Tax History Compared to Growth
Tax History
| Year | Tax Paid | Tax Assessment Tax Assessment Total Assessment is a certain percentage of the fair market value that is determined by local assessors to be the total taxable value of land and additions on the property. | Land | Improvement |
|---|---|---|---|---|
| 2025 | $2,951 | $321,000 | $125,000 | $196,000 |
| 2024 | $2,951 | $304,200 | $125,000 | $179,200 |
| 2023 | $2,866 | $289,500 | $117,000 | $172,500 |
| 2022 | $2,795 | $282,300 | $117,000 | $165,300 |
| 2021 | $2,465 | $249,000 | $88,000 | $161,000 |
| 2020 | $2,413 | $237,100 | $79,000 | $158,100 |
| 2019 | $2,466 | $235,400 | $77,000 | $158,400 |
| 2018 | $2,360 | $235,400 | $77,000 | $158,400 |
| 2017 | $2,197 | $219,200 | $74,500 | $144,700 |
| 2016 | $2,187 | $220,900 | $76,200 | $144,700 |
| 2015 | $2,060 | $208,100 | $76,200 | $131,900 |
| 2014 | $1,798 | $199,400 | $83,700 | $115,700 |
Source: Public Records
Map
Nearby Homes
- 4081 Joshua Ct
- 4012 Foxwood Dr
- 936 Joshua Dr
- 804 Hester Ln
- 1004 Banyan Dr
- 869 Point Way
- 847 Mission Ave
- 4115 Marblehead Dr
- 3917 Sutter St
- 4193 Thistle Cir
- 4549 Leamore Square Rd Unit 219
- 3920 Filbert Way
- 3888 Danville Ct
- 626 Orangewood Dr
- 4123 Eastham Rd
- 915 Chimney Hill Pkwy
- 4412 Barkingdale Dr
- 3888 Sweetbriar Ct
- 3607 Campion Ave
- 4557 Totteridge Ln
- 925 Appleby Ct
- 932 Appleby Ct
- 921 Appleby Ct
- 917 Appleby Ct
- 928 Appleby Ct
- 4084 Joshua Ct
- 4088 Joshua Ct
- 4073 Foxwood Dr
- 901 Appleby Ct
- 913 Appleby Ct
- 905 Appleby Ct
- 900 Appleby Ct
- 920 Appleby Ct
- 924 Appleby Ct
- 904 Appleby Ct
- 4069 Foxwood Dr
- 909 Appleby Ct
- 4092 Joshua Ct
- 916 Appleby Ct
- 908 Appleby Ct