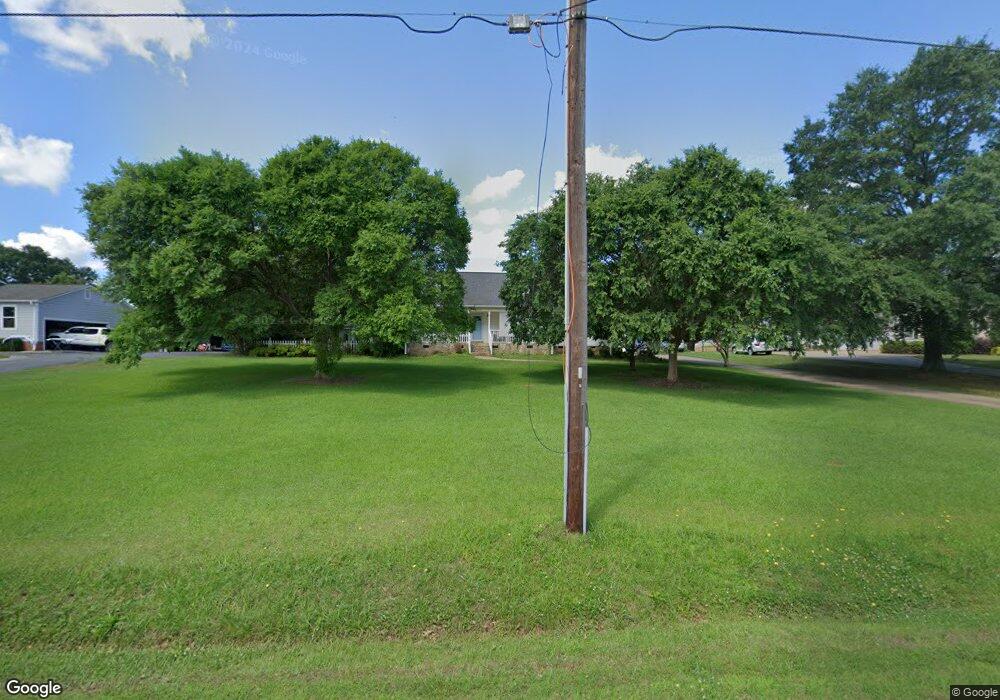
933 Belcher Rd Boiling Springs, SC 29316
Estimated Value: $284,000 - $320,000
3
Beds
2
Baths
1,801
Sq Ft
$171/Sq Ft
Est. Value
About This Home
This home is located at 933 Belcher Rd, Boiling Springs, SC 29316 and is currently estimated at $307,716, approximately $170 per square foot. 933 Belcher Rd is a home located in Spartanburg County with nearby schools including Boiling Springs Middle School, Boiling Springs High School, and High Point Academy.
Ownership History
Date
Name
Owned For
Owner Type
Purchase Details
Closed on
May 1, 2017
Sold by
Pike William Phillip and Pike Stacy Sim
Bought by
Elsey Margatte Helen
Current Estimated Value
Home Financials for this Owner
Home Financials are based on the most recent Mortgage that was taken out on this home.
Original Mortgage
$167,828
Outstanding Balance
$140,001
Interest Rate
4.3%
Mortgage Type
New Conventional
Estimated Equity
$167,715
Purchase Details
Closed on
Oct 21, 2016
Sold by
Davis Matthew Alan and Davis Leigh Easler
Bought by
Leigh William Phillip and Pike Stacy Sims
Home Financials for this Owner
Home Financials are based on the most recent Mortgage that was taken out on this home.
Original Mortgage
$160,606
Interest Rate
3.44%
Mortgage Type
New Conventional
Purchase Details
Closed on
Jun 21, 1999
Sold by
Cameron Danny S
Bought by
Davis Matthew A
Create a Home Valuation Report for This Property
The Home Valuation Report is an in-depth analysis detailing your home's value as well as a comparison with similar homes in the area
Home Values in the Area
Average Home Value in this Area
Purchase History
| Date | Buyer | Sale Price | Title Company |
|---|---|---|---|
| Elsey Margatte Helen | $166,150 | None Available | |
| Leigh William Phillip | $159,000 | None Available | |
| Davis Matthew A | $135,000 | -- |
Source: Public Records
Mortgage History
| Date | Status | Borrower | Loan Amount |
|---|---|---|---|
| Open | Elsey Margatte Helen | $167,828 | |
| Previous Owner | Leigh William Phillip | $160,606 |
Source: Public Records
Tax History Compared to Growth
Tax History
| Year | Tax Paid | Tax Assessment Tax Assessment Total Assessment is a certain percentage of the fair market value that is determined by local assessors to be the total taxable value of land and additions on the property. | Land | Improvement |
|---|---|---|---|---|
| 2025 | $1,299 | $7,636 | $876 | $6,760 |
| 2024 | $1,299 | $7,636 | $876 | $6,760 |
| 2023 | $1,299 | $7,636 | $876 | $6,760 |
| 2022 | $1,157 | $6,640 | $720 | $5,920 |
| 2021 | $1,155 | $6,640 | $720 | $5,920 |
| 2020 | $1,138 | $6,640 | $720 | $5,920 |
| 2019 | $1,138 | $6,640 | $720 | $5,920 |
| 2018 | $3,606 | $9,960 | $1,080 | $8,880 |
| 2017 | $1,072 | $6,360 | $720 | $5,640 |
| 2016 | $934 | $5,460 | $720 | $4,740 |
| 2015 | $931 | $5,464 | $720 | $4,744 |
| 2014 | $918 | $5,464 | $720 | $4,744 |
Source: Public Records
Map
Nearby Homes
- 240 Apple Branch Ln
- 408 Cider Park Dr
- 6011 Beasley Ct
- 6007 Beasley Ct
- 6014 Beasley Ct
- 741 Old Furnace Rd
- 5006 Atkins Way
- 4033 Hoskins Dr
- 479 Slate Dr
- 5002 Atkins Way
- 5005 Atkins Way
- 4038 Hoskins Dr
- 5001 Atkins Way
- 4030 Hoskins Dr
- 4026 Hoskins Dr
- 370 Slate Dr
- Liston Plan at Sparrow Creek - Reserve
- Valen Plan at Sparrow Creek - Summit
- Winthrop Plan at Sparrow Creek - Summit
- Heston Plan at Sparrow Creek - Summit
- 929 Belcher Rd
- 939 Belcher Rd
- 919 Belcher Rd
- 234 David Koon Dr
- 238 David Koon Dr
- 230 David Koon Dr
- 928 Belcher Rd
- 938 Belcher Rd
- 913 Belcher Rd
- 226 David Koon Dr
- 918 Belcher Rd
- 1081 Belcher Rd
- 908 Belcher Rd
- 222 David Koon Dr
- 909 Belcher Rd
- 237 David Koon Dr
- 233 David Koon Dr
- 229 David Koon Dr
- 218 David Koon Dr
- 1060 Belcher Rd