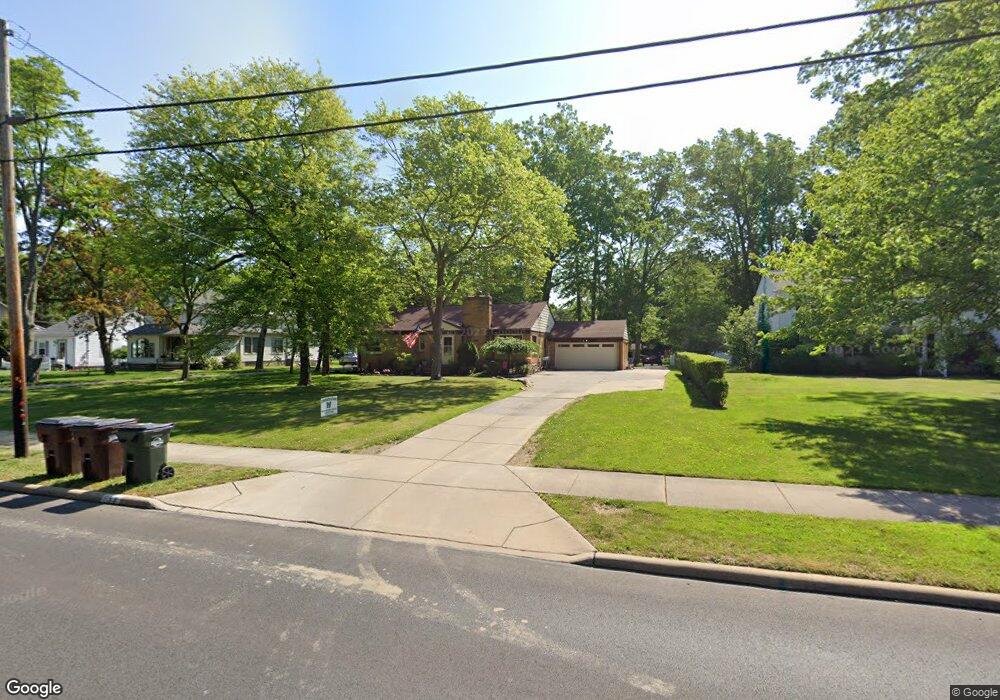
933 Dover Center Rd Westlake, OH 44145
Estimated Value: $281,000 - $320,000
3
Beds
1
Bath
1,482
Sq Ft
$199/Sq Ft
Est. Value
About This Home
This home is located at 933 Dover Center Rd, Westlake, OH 44145 and is currently estimated at $295,111, approximately $199 per square foot. 933 Dover Center Rd is a home located in Cuyahoga County with nearby schools including Westlake Elementary School, Dover Intermediate School, and Lee Burneson Middle School.
Ownership History
Date
Name
Owned For
Owner Type
Purchase Details
Closed on
Dec 27, 2021
Sold by
Liuzzo Dennis and Webb Sue
Bought by
Webb Sue
Current Estimated Value
Purchase Details
Closed on
Apr 5, 2017
Sold by
Liuzzo Dennis
Bought by
Liuzzo Dennis and Webb Sue
Purchase Details
Closed on
Oct 29, 2013
Sold by
Fish Funding Llc
Bought by
Liuzzo Dennis
Home Financials for this Owner
Home Financials are based on the most recent Mortgage that was taken out on this home.
Original Mortgage
$132,554
Interest Rate
4.25%
Mortgage Type
FHA
Purchase Details
Closed on
Jun 5, 2012
Sold by
Banner Jill M
Bought by
Fish Funding Llc
Purchase Details
Closed on
Jun 26, 2002
Sold by
Gruss Raymond S
Bought by
Banner Jill M
Home Financials for this Owner
Home Financials are based on the most recent Mortgage that was taken out on this home.
Original Mortgage
$106,150
Interest Rate
6.93%
Purchase Details
Closed on
Jan 1, 1988
Bought by
Gruss Albert M
Create a Home Valuation Report for This Property
The Home Valuation Report is an in-depth analysis detailing your home's value as well as a comparison with similar homes in the area
Home Values in the Area
Average Home Value in this Area
Purchase History
| Date | Buyer | Sale Price | Title Company |
|---|---|---|---|
| Webb Sue | -- | Webb Sue | |
| Liuzzo Dennis | -- | None Available | |
| Liuzzo Dennis | $135,000 | Liberty Title | |
| Fish Funding Llc | -- | Attorney | |
| Banner Jill M | $124,900 | Prospect Title Agency Inc | |
| Gruss Albert M | -- | -- |
Source: Public Records
Mortgage History
| Date | Status | Borrower | Loan Amount |
|---|---|---|---|
| Previous Owner | Liuzzo Dennis | $132,554 | |
| Previous Owner | Banner Jill M | $106,150 | |
| Closed | Banner Jill M | $12,450 |
Source: Public Records
Tax History Compared to Growth
Tax History
| Year | Tax Paid | Tax Assessment Tax Assessment Total Assessment is a certain percentage of the fair market value that is determined by local assessors to be the total taxable value of land and additions on the property. | Land | Improvement |
|---|---|---|---|---|
| 2024 | $4,011 | $84,665 | $22,400 | $62,265 |
| 2023 | $3,512 | $63,180 | $20,160 | $43,020 |
| 2022 | $3,456 | $63,180 | $20,160 | $43,020 |
| 2021 | $3,461 | $63,180 | $20,160 | $43,020 |
| 2020 | $3,367 | $56,390 | $17,990 | $38,400 |
| 2019 | $3,265 | $161,100 | $51,400 | $109,700 |
| 2018 | $3,323 | $56,390 | $17,990 | $38,400 |
| 2017 | $3,453 | $55,870 | $15,440 | $40,430 |
| 2016 | $3,435 | $55,060 | $15,440 | $39,620 |
| 2015 | $3,223 | $55,060 | $15,440 | $39,620 |
| 2014 | $3,223 | $51,450 | $14,420 | $37,030 |
Source: Public Records
Map
Nearby Homes
- 27320 Langale Rd
- 26927 E Oviatt Rd
- 1326 Marview Dr
- 27841 Birchwood Ct
- 1528 Dover Center Rd
- 1359 Marview Dr
- 1455 Mozart Dr
- 879 S Parkside Dr
- 841 S Parkside Dr
- 27870 Birchwood Ct
- 27029 Normandy Rd
- 1504 Beethoven Dr
- 26819 Normandy Rd
- 27028 Normandy Rd
- 551 Elmwood Rd
- 495 Cahoon Rd
- 1432 Stone Ct
- 483 Cahoon Rd
- 481 Cahoon Rd
- 468 Canterbury Rd
- 921 Dover Center Rd
- 945 Dover Center Rd
- 903 Dover Center Rd
- 963 Dover Center Rd
- 891 Dover Center Rd
- 934 Dover Center Rd
- 922 Dover Center Rd
- 969 Dover Center Rd
- 904 Dover Center Rd
- 881 Dover Center Rd
- 962 Dover Center Rd
- 942 Dominion Dr
- 960 Dominion Dr
- 792 Carriage Park Oval
- 985 Dover Center Rd
- 873 Dover Center Rd
- 970 Dover Center Rd
- 974 Dominion Dr
- 930 Dominion Dr
- 27295 Georgetown Dr