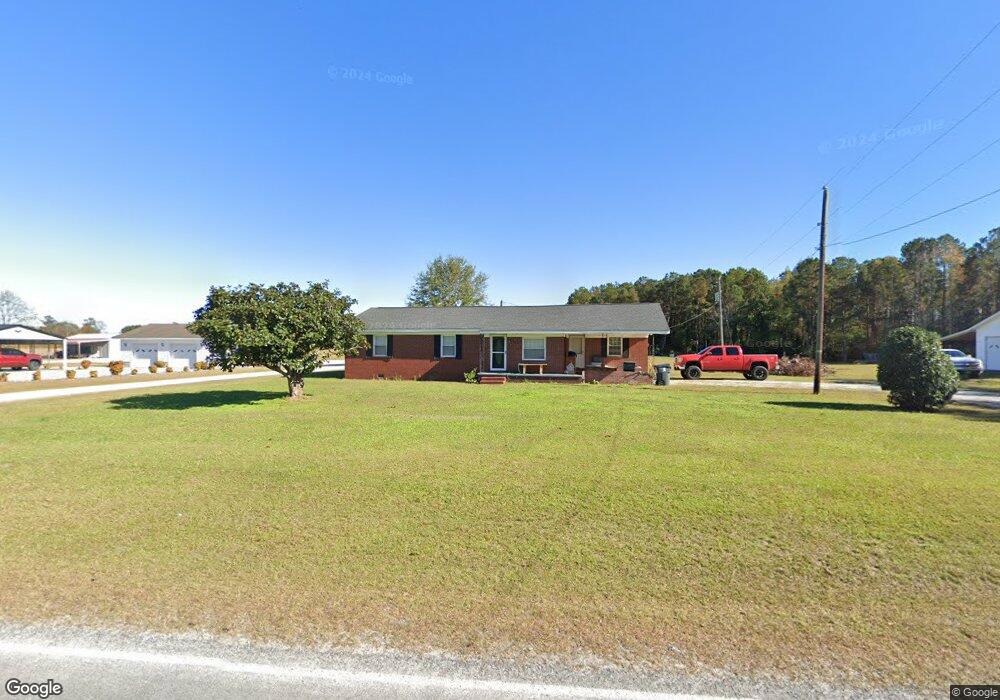
933 Garland Duncan Rd Chadbourn, NC 28431
Estimated Value: $156,000 - $332,000
--
Bed
--
Bath
1,400
Sq Ft
$156/Sq Ft
Est. Value
About This Home
This home is located at 933 Garland Duncan Rd, Chadbourn, NC 28431 and is currently estimated at $217,791, approximately $155 per square foot. 933 Garland Duncan Rd is a home located in Columbus County with nearby schools including South Columbus High School.
Ownership History
Date
Name
Owned For
Owner Type
Purchase Details
Closed on
Jan 17, 2024
Sold by
Mckeithan Magon Lee and Mckeithan Richard
Bought by
West Christopher Nathaniel and West Jamison Leigh
Current Estimated Value
Home Financials for this Owner
Home Financials are based on the most recent Mortgage that was taken out on this home.
Original Mortgage
$150,000
Outstanding Balance
$147,473
Interest Rate
7.15%
Mortgage Type
New Conventional
Estimated Equity
$70,318
Purchase Details
Closed on
Dec 7, 2017
Sold by
Mckeithan Bryan Ladon
Bought by
Mckeithan Magon Lee
Purchase Details
Closed on
Oct 7, 2005
Sold by
Mckeithan Carolyn Sue and Mckeithan Donnie Lee
Bought by
Mckeithan Bryan Ladon and Mckeithan Magon Lee
Home Financials for this Owner
Home Financials are based on the most recent Mortgage that was taken out on this home.
Original Mortgage
$32,700
Interest Rate
5.66%
Mortgage Type
Purchase Money Mortgage
Create a Home Valuation Report for This Property
The Home Valuation Report is an in-depth analysis detailing your home's value as well as a comparison with similar homes in the area
Home Values in the Area
Average Home Value in this Area
Purchase History
| Date | Buyer | Sale Price | Title Company |
|---|---|---|---|
| West Christopher Nathaniel | $150,000 | None Listed On Document | |
| West Christopher Nathaniel | $150,000 | None Listed On Document | |
| Mckeithan Magon Lee | -- | None Available | |
| Mckeithan Bryan Ladon | $65,500 | -- |
Source: Public Records
Mortgage History
| Date | Status | Borrower | Loan Amount |
|---|---|---|---|
| Open | West Christopher Nathaniel | $150,000 | |
| Closed | West Christopher Nathaniel | $150,000 | |
| Previous Owner | Mckeithan Bryan Ladon | $32,700 |
Source: Public Records
Tax History Compared to Growth
Tax History
| Year | Tax Paid | Tax Assessment Tax Assessment Total Assessment is a certain percentage of the fair market value that is determined by local assessors to be the total taxable value of land and additions on the property. | Land | Improvement |
|---|---|---|---|---|
| 2024 | -- | $81,000 | $6,800 | $74,200 |
| 2023 | $917 | $81,000 | $6,800 | $74,200 |
| 2022 | $917 | $81,000 | $6,800 | $74,200 |
| 2021 | $917 | $81,000 | $6,800 | $74,200 |
| 2020 | $811 | $69,000 | $6,800 | $62,200 |
| 2019 | $811 | $69,000 | $6,800 | $62,200 |
| 2018 | $811 | $69,000 | $6,800 | $62,200 |
| 2017 | $798 | $67,200 | $5,000 | $62,200 |
| 2016 | $803 | $67,200 | $5,000 | $62,200 |
| 2015 | $813 | $67,200 | $5,000 | $62,200 |
| 2014 | $813 | $67,200 | $5,000 | $62,200 |
Source: Public Records
Map
Nearby Homes
- 90 Hinson Dr
- Near 93 Williams
- 8513 Joe Brown Hwy S
- 8202 Joe Brown Hwy S
- 15 Pear
- 798 Sellers Town Rd
- 7424 James B White Hwy S
- 7158 Joe Brown Hwy S
- 8658 Joe Brown Hwy S
- 3665 Midway Dr
- 29 Fairfield Dr W
- 000 Butler Town Rd
- 0 No Where Rd Unit Butler Town Road
- 343 W R Cribb Dr
- 0000 Clarendon Chadbourn Rd
- 1309 Gaston Sellers Rd
- 6447 James B White Hwy S
- 1948 Antioch Church Rd
- Lot# 44 Singletary Rd
- 3551 Williams Rd
- 990 Garland Duncan Rd
- 856 Garland Duncan Rd
- 935 Garland Duncan Rd
- 944 Garland Duncan Rd
- 1053 Garland Duncan Rd
- 1425 Old Cribbtown Rd
- 1144 Garland Duncan Rd
- 738 Garland Duncan Rd
- 1219 Garland Duncan Rd
- 1585 Old Cribbtown Rd
- 1252 Garland Duncan Rd
- 1278 Garland Duncan Rd
- 1574 Old Cribbtown Rd
- 1650 Old Cribbtown Rd
- 579 Garland Duncan Rd
- 579 Garland Dunca Rd
- 1309 Garland Duncan Rd
- 1250 Old Cribbtown Rd
- 215 R and D Carteret Ln
- 1935 Old Cribbtown Rd