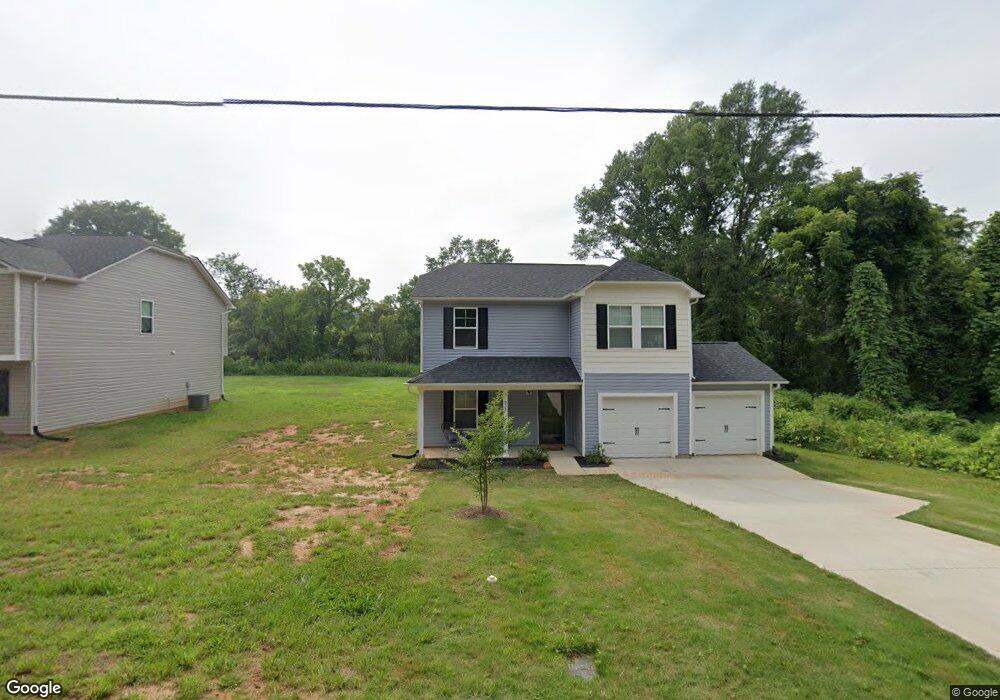
933 Grace St Kings Mountain, NC 28086
Estimated Value: $267,000 - $289,000
--
Bed
--
Bath
1,706
Sq Ft
$163/Sq Ft
Est. Value
About This Home
This home is located at 933 Grace St, Kings Mountain, NC 28086 and is currently estimated at $278,589, approximately $163 per square foot. 933 Grace St is a home with nearby schools including East Elementary School, Kings Mountain Middle, and Kings Mountain Intermediate School.
Ownership History
Date
Name
Owned For
Owner Type
Purchase Details
Closed on
Apr 29, 2022
Sold by
Pop Homes Llc
Bought by
Wilmore Kimberly C
Current Estimated Value
Home Financials for this Owner
Home Financials are based on the most recent Mortgage that was taken out on this home.
Original Mortgage
$8,000
Outstanding Balance
$7,520
Interest Rate
4.16%
Mortgage Type
New Conventional
Estimated Equity
$271,069
Purchase Details
Closed on
Oct 12, 2021
Sold by
Bvj Properties Llc
Bought by
Pop Homes Llc
Home Financials for this Owner
Home Financials are based on the most recent Mortgage that was taken out on this home.
Original Mortgage
$524,993
Interest Rate
2.8%
Mortgage Type
Future Advance Clause Open End Mortgage
Purchase Details
Closed on
Jul 26, 2021
Sold by
Brinkley Prop Of Kings Mountain Llc
Bought by
Bvj Properties Llc
Purchase Details
Closed on
Sep 17, 2020
Sold by
Mcintosh Theresa F and Mcintosh Mark E
Bought by
Brinkley Prop Of Kings Mountain Llc
Create a Home Valuation Report for This Property
The Home Valuation Report is an in-depth analysis detailing your home's value as well as a comparison with similar homes in the area
Home Values in the Area
Average Home Value in this Area
Purchase History
| Date | Buyer | Sale Price | Title Company |
|---|---|---|---|
| Wilmore Kimberly C | $226,000 | Investors Title | |
| Pop Homes Llc | $114,000 | Investors Title Insurance Co | |
| Pop Home Llc | $114,000 | None Listed On Document | |
| Bvj Properties Llc | $60,000 | None Available | |
| Brinkley Prop Of Kings Mountain Llc | $8,000 | None Available |
Source: Public Records
Mortgage History
| Date | Status | Borrower | Loan Amount |
|---|---|---|---|
| Open | Wilmore Kimberly C | $8,000 | |
| Previous Owner | Pop Home Llc | $524,993 | |
| Previous Owner | Pop Home Llc | $167,247 |
Source: Public Records
Tax History Compared to Growth
Tax History
| Year | Tax Paid | Tax Assessment Tax Assessment Total Assessment is a certain percentage of the fair market value that is determined by local assessors to be the total taxable value of land and additions on the property. | Land | Improvement |
|---|---|---|---|---|
| 2025 | $2,651 | $258,670 | $22,755 | $235,915 |
| 2024 | $1,988 | $168,174 | $10,922 | $157,252 |
| 2023 | $1,978 | $168,174 | $10,922 | $157,252 |
| 2022 | $121 | $10,922 | $10,922 | $0 |
| 2021 | $95 | $8,467 | $8,467 | $0 |
| 2020 | $92 | $8,043 | $8,043 | $0 |
| 2019 | $92 | $8,043 | $8,043 | $0 |
| 2018 | $92 | $8,043 | $8,043 | $0 |
| 2017 | $92 | $8,043 | $8,043 | $0 |
| 2016 | $92 | $8,043 | $8,043 | $0 |
| 2015 | $78 | $6,985 | $6,985 | $0 |
| 2014 | $78 | $6,985 | $6,985 | $0 |
Source: Public Records
Map
Nearby Homes
- 921 Church St
- 1001 Church St
- 823 1st St
- 205 Stowe Acres
- 711 Groves St
- 215 Benfield Rd
- 213 Benfield Rd
- 223 # Benfield Rd
- 223 Benfield Rd
- 814 Grace St
- 120 Center St
- 808 3rd St
- 810 4th St
- 702 Rhodes Ave
- 527 Katherine Ave
- 1000 Linwood Rd
- 1220 N Piedmont Ave
- 914 Woodside Dr
- 1003 Ramseur St
- 409 Chestnut St