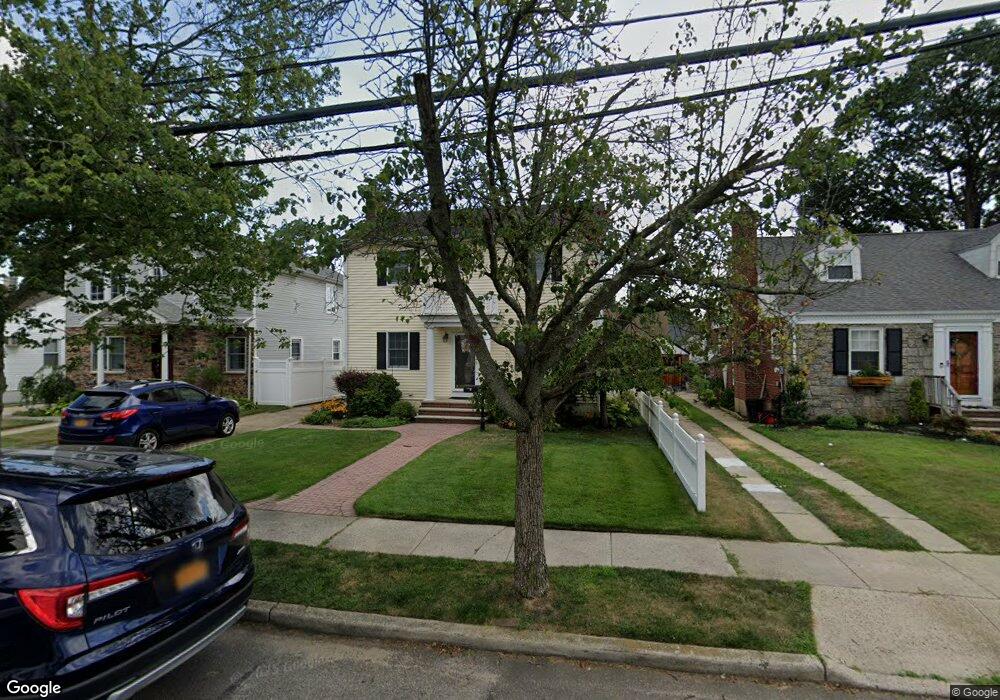
933 Hancock Ave Franklin Square, NY 11010
Estimated Value: $745,886 - $939,000
Studio
2
Baths
1,680
Sq Ft
$501/Sq Ft
Est. Value
About This Home
This home is located at 933 Hancock Ave, Franklin Square, NY 11010 and is currently estimated at $842,443, approximately $501 per square foot. 933 Hancock Ave is a home located in Nassau County with nearby schools including Hebrew Academy of Nassau County (HANC).
Ownership History
Date
Name
Owned For
Owner Type
Purchase Details
Closed on
Jul 22, 2015
Sold by
Hart Simonelli Jeanne and Hart Maureen B
Bought by
Casil Dana and Dicarlo Dana Christine
Current Estimated Value
Home Financials for this Owner
Home Financials are based on the most recent Mortgage that was taken out on this home.
Original Mortgage
$401,250
Outstanding Balance
$314,718
Interest Rate
4.03%
Mortgage Type
New Conventional
Estimated Equity
$527,725
Purchase Details
Closed on
Jan 26, 2010
Sold by
Simonelli Micheal and Simonelli Jeanne Hart
Bought by
Simonelli Jeanne Hart and Hart Maureen B
Home Financials for this Owner
Home Financials are based on the most recent Mortgage that was taken out on this home.
Original Mortgage
$422,262
Interest Rate
5.5%
Mortgage Type
FHA
Purchase Details
Closed on
Jun 11, 1998
Sold by
Strianese Anthony
Bought by
Simonelli Michael and Simonelli Jeanne
Purchase Details
Closed on
Dec 19, 1997
Sold by
Public Dic Occo
Bought by
Strianese Anthony
Create a Home Valuation Report for This Property
The Home Valuation Report is an in-depth analysis detailing your home's value as well as a comparison with similar homes in the area
Home Values in the Area
Average Home Value in this Area
Purchase History
| Date | Buyer | Sale Price | Title Company |
|---|---|---|---|
| Casil Dana | $535,000 | Fidelity National Title | |
| Simonelli Jeanne Hart | -- | -- | |
| Simonelli Michael | $174,500 | -- | |
| Strianese Anthony | $136,000 | -- |
Source: Public Records
Mortgage History
| Date | Status | Borrower | Loan Amount |
|---|---|---|---|
| Open | Casil Dana | $401,250 | |
| Previous Owner | Simonelli Jeanne Hart | $422,262 |
Source: Public Records
Tax History
| Year | Tax Paid | Tax Assessment Tax Assessment Total Assessment is a certain percentage of the fair market value that is determined by local assessors to be the total taxable value of land and additions on the property. | Land | Improvement |
|---|---|---|---|---|
| 2025 | $11,930 | $548 | $233 | $315 |
| 2024 | $4,716 | $549 | $234 | $315 |
Source: Public Records
Map
Nearby Homes
- 1020 Polk Ave
- 242 James St
- 912 Oaks Dr
- 1004 Wool Ave
- 1024 Oaks Dr
- 1035 Glen Dr
- 850 First Ave
- 280 Franklin Ave Unit 11
- 1132 Norbay St
- 340 Doris Ave
- 1007 Third Ave
- 298 Doris Ave
- 190 Commonwealth St
- 970 Benris Ave
- 1053 Lorraine Dr
- 562 Bernice Rd
- 1119 Theodora St
- 249 Grange St
- 1041 Mosefan St
- 232 Ribbon St
- 929 Hancock Ave
- 937 Hancock Ave
- 923 Hancock Ave
- 943 Hancock Ave
- 934 Van Buren Ave
- 930 Van Buren Ave
- 938 Van Buren Ave
- 947 Hancock Ave
- 934 Hancock Ave
- 934 Hancock St
- 942 Van Buren Ave
- 930 Hancock Ave
- 372 Madison St
- 938 Hancock Ave
- 913 Hancock Ave
- 920 Van Buren Ave
- 924 Hancock Ave
- 951 Hancock Ave
- 944 Hancock Ave
- 948 Van Buren Ave
Your Personal Tour Guide
Ask me questions while you tour the home.