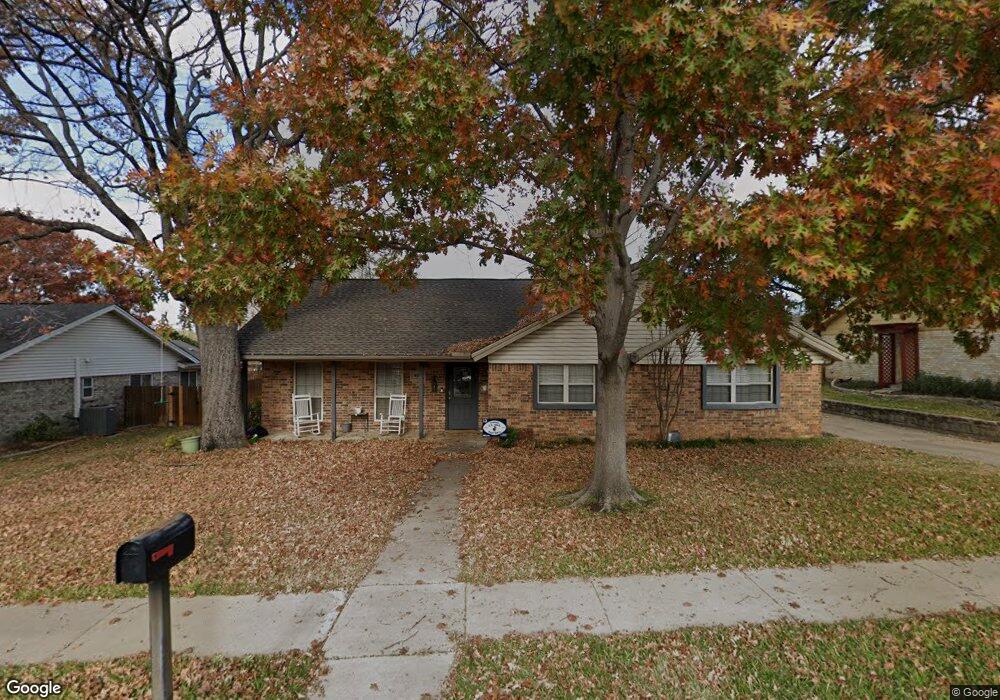
933 Harwood Terrace Bedford, TX 76021
Estimated Value: $414,124 - $445,000
3
Beds
2
Baths
2,005
Sq Ft
$213/Sq Ft
Est. Value
About This Home
This home is located at 933 Harwood Terrace, Bedford, TX 76021 and is currently estimated at $426,531, approximately $212 per square foot. 933 Harwood Terrace is a home located in Tarrant County with nearby schools including Bedford Heights Elementary School, Bedford Junior High School, and L.D. Bell High School.
Ownership History
Date
Name
Owned For
Owner Type
Purchase Details
Closed on
Jun 5, 2014
Sold by
Velocity Fund I Llc
Bought by
Gonzales Kelly
Current Estimated Value
Home Financials for this Owner
Home Financials are based on the most recent Mortgage that was taken out on this home.
Original Mortgage
$186,800
Outstanding Balance
$143,040
Interest Rate
4.38%
Mortgage Type
New Conventional
Estimated Equity
$283,491
Purchase Details
Closed on
Apr 17, 2013
Sold by
Montage Development Company Llc
Bought by
Velocity Fund I Llc
Purchase Details
Closed on
Apr 15, 2013
Sold by
Roland Mary R and Holderness Aaron Brent
Bought by
Montage Development Co Llc
Purchase Details
Closed on
Apr 30, 2004
Sold by
Mcreynolds Tjuana
Bought by
Roland Mary R
Home Financials for this Owner
Home Financials are based on the most recent Mortgage that was taken out on this home.
Original Mortgage
$133,878
Interest Rate
5.38%
Mortgage Type
FHA
Create a Home Valuation Report for This Property
The Home Valuation Report is an in-depth analysis detailing your home's value as well as a comparison with similar homes in the area
Home Values in the Area
Average Home Value in this Area
Purchase History
| Date | Buyer | Sale Price | Title Company |
|---|---|---|---|
| Gonzales Kelly | -- | Stewart | |
| Velocity Fund I Llc | -- | None Available | |
| Montage Development Co Llc | -- | None Available | |
| Roland Mary R | -- | Nat |
Source: Public Records
Mortgage History
| Date | Status | Borrower | Loan Amount |
|---|---|---|---|
| Open | Gonzales Kelly | $186,800 | |
| Previous Owner | Roland Mary R | $133,878 |
Source: Public Records
Tax History Compared to Growth
Tax History
| Year | Tax Paid | Tax Assessment Tax Assessment Total Assessment is a certain percentage of the fair market value that is determined by local assessors to be the total taxable value of land and additions on the property. | Land | Improvement |
|---|---|---|---|---|
| 2025 | $5,261 | $347,613 | $80,000 | $267,613 |
| 2024 | $5,261 | $347,613 | $80,000 | $267,613 |
| 2023 | $5,850 | $305,000 | $60,000 | $245,000 |
| 2022 | $6,391 | $292,617 | $60,000 | $232,617 |
| 2021 | $6,327 | $268,614 | $60,000 | $208,614 |
| 2020 | $6,903 | $290,352 | $60,000 | $230,352 |
| 2019 | $6,902 | $292,196 | $60,000 | $232,196 |
| 2018 | $5,892 | $258,264 | $60,000 | $198,264 |
| 2017 | $5,731 | $239,029 | $30,000 | $209,029 |
| 2016 | $5,210 | $215,378 | $30,000 | $185,378 |
| 2015 | $4,086 | $202,712 | $30,000 | $172,712 |
| 2014 | $4,086 | $162,700 | $20,000 | $142,700 |
Source: Public Records
Map
Nearby Homes
- 909 Brestol Ct W
- 3624 Wayne Ct
- 3609 Wayne Ct
- 1109 Simpson Terrace
- 628 Huntwich Dr
- 3605 Spring Valley Dr
- 1136 Wingate Dr
- 4002 Copperwood Ct
- 3907 Copperwood Ct
- 913 Kensington Ct
- 1209 Hillandale Ct
- 4105 Inwood Ln
- 3301 Wendover Ct
- 1303 Crest Dr
- 3213 Spring Valley Dr
- 405 Woodbriar Ct
- 1421 Plantation Dr N
- 3119 Spring Grove Dr
- 801 Shady Creek Ln
- 305 Warbler Dr
- 937 Harwood Terrace
- 929 Harwood Terrace
- 904 Brestol Ct E
- 908 Brestol Ct E
- 900 Brestol Ct E
- 941 Harwood Terrace
- 3621 Berwick Ln
- 3632 Wayne Ct
- 912 Brestol Ct E
- 945 Harwood Terrace
- 925 Harwood Terrace
- 3617 Berwick Ln
- 3628 Wayne Ct
- 920 Brestol Ct W
- 920 Brestol Ct W
- 3616 Berwick Ln
- 916 Brestol Ct E
- 3633 Wayne Ct
- 905 Brestol Ct E
- 949 Harwood Terrace