Estimated Value: $167,000 - $202,963
2
Beds
2
Baths
1,528
Sq Ft
$123/Sq Ft
Est. Value
About This Home
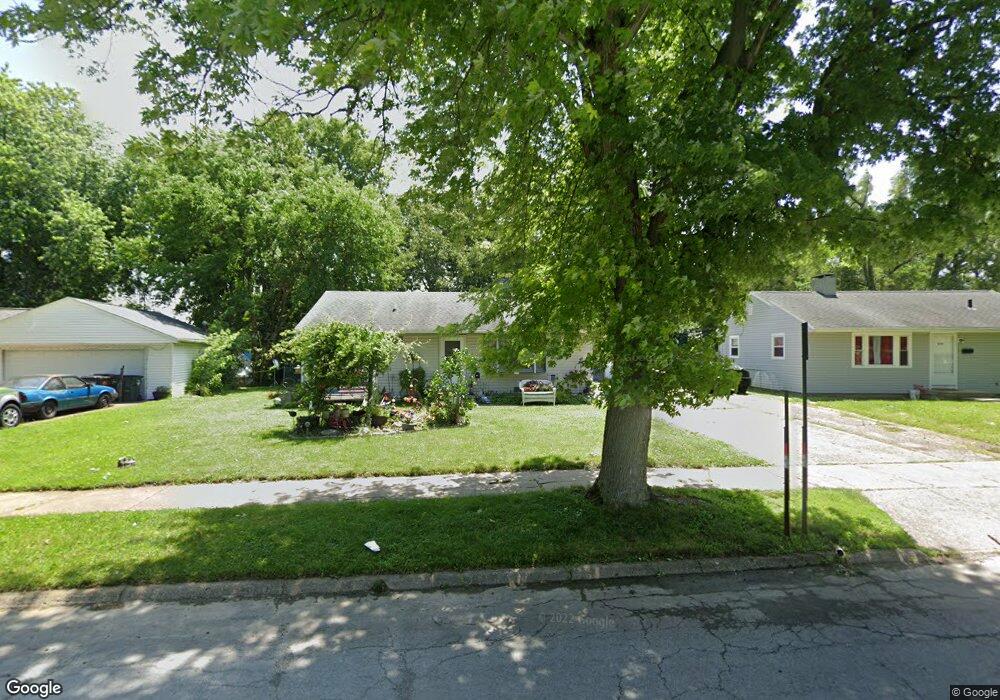
This home is located at 933 June Dr, Xenia, OH 45385 and is currently estimated at $188,241, approximately $123 per square foot. 933 June Dr is a home located in Greene County with nearby schools including Xenia High School, Summit Academy Community School for Alternative Learners - Xenia, and Legacy Christian Academy.
Ownership History
Date
Name
Owned For
Owner Type
Purchase Details
Closed on
Apr 27, 2000
Sold by
Va
Bought by
Moore Billy Ray and Moore Patricia Ann
Current Estimated Value
Home Financials for this Owner
Home Financials are based on the most recent Mortgage that was taken out on this home.
Original Mortgage
$56,700
Outstanding Balance
$19,729
Interest Rate
8.24%
Estimated Equity
$168,512
Purchase Details
Closed on
Dec 15, 1999
Sold by
Maxwell Anthony A
Bought by
Va
Purchase Details
Closed on
Dec 13, 1999
Sold by
Maxwell Anthony A and Doe Jane
Bought by
Va
Purchase Details
Closed on
Nov 24, 1999
Sold by
Maxwell Anthony A
Bought by
Va
Purchase Details
Closed on
Dec 11, 1997
Sold by
Lynch Anne L
Bought by
Maxwell Anthony A
Home Financials for this Owner
Home Financials are based on the most recent Mortgage that was taken out on this home.
Original Mortgage
$77,147
Interest Rate
7.32%
Mortgage Type
VA
Create a Home Valuation Report for This Property
The Home Valuation Report is an in-depth analysis detailing your home's value as well as a comparison with similar homes in the area
Home Values in the Area
Average Home Value in this Area
Purchase History
| Date | Buyer | Sale Price | Title Company |
|---|---|---|---|
| Moore Billy Ray | -- | Home Site Title Agency Inc | |
| Va | $53,000 | -- | |
| Va | $53,000 | -- | |
| Va | $53,000 | -- | |
| Maxwell Anthony A | $74,900 | -- |
Source: Public Records
Mortgage History
| Date | Status | Borrower | Loan Amount |
|---|---|---|---|
| Open | Moore Billy Ray | $56,700 | |
| Previous Owner | Maxwell Anthony A | $77,147 |
Source: Public Records
Tax History Compared to Growth
Tax History
| Year | Tax Paid | Tax Assessment Tax Assessment Total Assessment is a certain percentage of the fair market value that is determined by local assessors to be the total taxable value of land and additions on the property. | Land | Improvement |
|---|---|---|---|---|
| 2024 | $1,966 | $56,960 | $10,370 | $46,590 |
| 2023 | $1,966 | $56,960 | $10,370 | $46,590 |
| 2022 | $1,512 | $39,660 | $7,410 | $32,250 |
| 2021 | $1,532 | $39,660 | $7,410 | $32,250 |
| 2020 | $1,466 | $39,660 | $7,410 | $32,250 |
| 2019 | $1,143 | $31,430 | $5,280 | $26,150 |
| 2018 | $1,633 | $31,430 | $5,280 | $26,150 |
| 2017 | $1,537 | $31,430 | $5,280 | $26,150 |
| 2016 | $1,537 | $29,040 | $5,280 | $23,760 |
| 2015 | $1,542 | $29,040 | $5,280 | $23,760 |
| 2014 | $1,476 | $29,040 | $5,280 | $23,760 |
Source: Public Records
Map
Nearby Homes