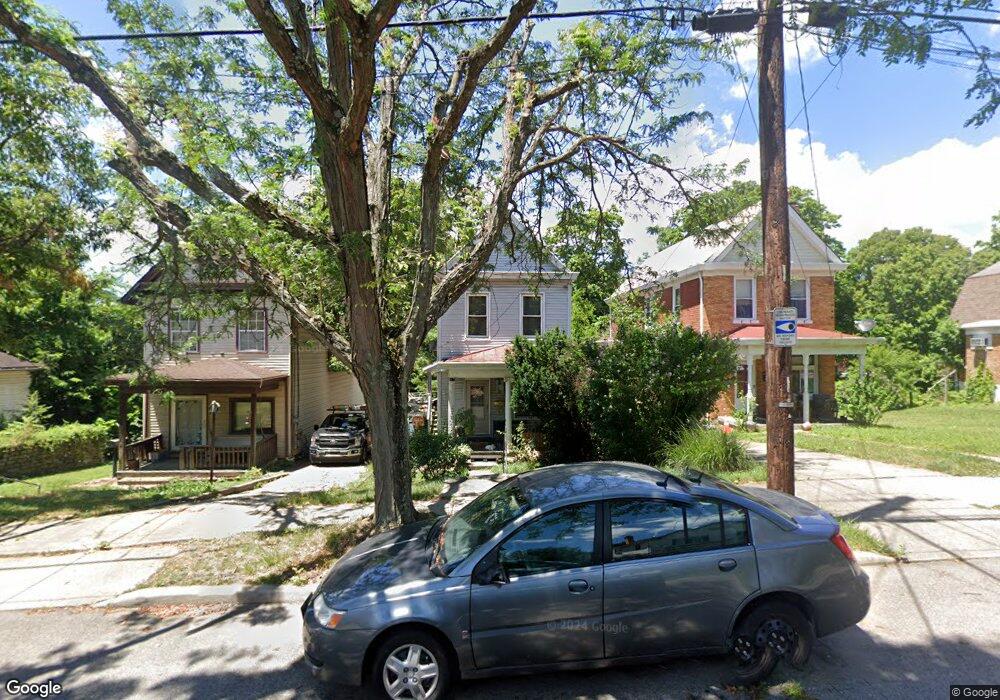
933 Kirbert Ave Cincinnati, OH 45205
East Price Hill NeighborhoodEstimated Value: $104,000 - $150,000
3
Beds
1
Bath
1,444
Sq Ft
$88/Sq Ft
Est. Value
About This Home
This home is located at 933 Kirbert Ave, Cincinnati, OH 45205 and is currently estimated at $127,458, approximately $88 per square foot. 933 Kirbert Ave is a home located in Hamilton County with nearby schools including Carson School, Gilbert A. Dater High School, and Western Hills High School.
Ownership History
Date
Name
Owned For
Owner Type
Purchase Details
Closed on
Feb 15, 2020
Sold by
Hendley Michael and Hendley Linda
Bought by
Hendley Denise M
Current Estimated Value
Purchase Details
Closed on
Apr 5, 2019
Sold by
Hendley Paula Marie and Hendley Paula M
Bought by
Hendley Denise M
Purchase Details
Closed on
Dec 6, 2017
Sold by
Richey Kathleen M
Bought by
Hendley Denise M
Purchase Details
Closed on
May 1, 2017
Sold by
Hendley James Leo and Hendley Tamara S
Bought by
Hendley Denise M
Purchase Details
Closed on
Nov 21, 2006
Sold by
Estate Of Patricia Scroggins
Bought by
Scroggins Leo Elwood and Lucke Debbie
Purchase Details
Closed on
Nov 14, 2006
Sold by
Estate Of Leo Hendley Sr
Bought by
Hendley John X and Hendley Leo
Purchase Details
Closed on
Feb 22, 2006
Sold by
Estate Of John X Hendley
Bought by
Hendley Leo A and Hendley Thomas L
Create a Home Valuation Report for This Property
The Home Valuation Report is an in-depth analysis detailing your home's value as well as a comparison with similar homes in the area
Home Values in the Area
Average Home Value in this Area
Purchase History
| Date | Buyer | Sale Price | Title Company |
|---|---|---|---|
| Hendley Denise M | -- | None Available | |
| Hendley Denise M | $1,400 | None Available | |
| Hendley Denise M | $1,307 | None Available | |
| Hendley Denise M | $2,363 | None Available | |
| Scroggins Leo Elwood | -- | Attorney | |
| Hendley Michael | -- | Attorney | |
| Hendley John X | -- | Attorney | |
| Hendley Leo A | -- | Attorney |
Source: Public Records
Tax History
| Year | Tax Paid | Tax Assessment Tax Assessment Total Assessment is a certain percentage of the fair market value that is determined by local assessors to be the total taxable value of land and additions on the property. | Land | Improvement |
|---|---|---|---|---|
| 2025 | $1,564 | $25,204 | $2,538 | $22,666 |
| 2024 | $1,520 | $25,204 | $2,538 | $22,666 |
| 2023 | $1,552 | $25,204 | $2,538 | $22,666 |
| 2022 | $908 | $13,150 | $2,244 | $10,906 |
| 2021 | $874 | $13,150 | $2,244 | $10,906 |
| 2020 | $897 | $13,150 | $2,244 | $10,906 |
| 2019 | $892 | $11,957 | $2,041 | $9,916 |
| 2018 | $894 | $11,957 | $2,041 | $9,916 |
| 2017 | $886 | $11,957 | $2,041 | $9,916 |
| 2016 | $937 | $12,352 | $2,282 | $10,070 |
| 2015 | $838 | $12,352 | $2,282 | $10,070 |
| 2014 | $843 | $12,352 | $2,282 | $10,070 |
| 2013 | $883 | $12,733 | $2,352 | $10,381 |
Source: Public Records
Map
Nearby Homes
- 945 Enright Ave
- 808 Kirbert Ave
- 921 Mcpherson Ave
- 3719 Laclede Ave
- 924 Mcpherson Ave
- 824 Mcpherson Ave
- 831 Suire Ave
- 741 Mcpherson Ave
- 843 Fairbanks Ave
- 1136 Gilsey Ave
- 1044 Rosemont Ave
- 966 Fairbanks Ave
- 1231 Ridlen Ave
- 812 Fairbanks Ave
- 776 Wells St
- 1002 Winfield Ave
- 3744 Mayfield Ave
- 3424 Kensington Place
- 1110 Winfield Ave
- 962 Mansion Ave
- 925 Kirbert Ave
- 935 Kirbert Ave
- 923 Kirbert Ave
- 939 Kirbert Ave
- 943 Kirbert Ave
- 934 Seton Ave
- 920 Seton Ave
- 947 Kirbert Ave
- 936 Seton Ave
- 916 Seton Ave
- 938 Seton Ave
- 951 Kirbert Ave
- 938 Kirbert Ave
- 938 Kirbert Ave
- 934 Kirbert Ave
- 909 Kirbert Ave
- 922 Kirbert Ave
- 918 Kirbert Ave
- 955 Kirbert Ave
- 905 Kirbert Ave
Your Personal Tour Guide
Ask me questions while you tour the home.