Estimated Value: $223,423 - $301,000
--
Bed
--
Bath
1,980
Sq Ft
$134/Sq Ft
Est. Value
About This Home
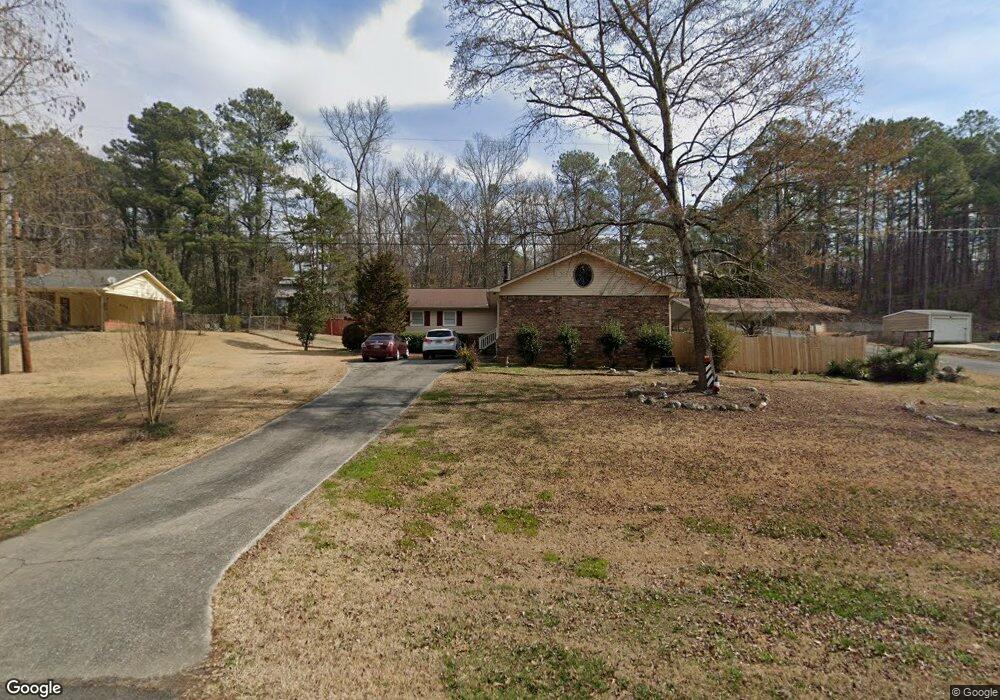
This home is located at 933 Mays Bridge Rd SW, Rome, GA 30165 and is currently estimated at $265,356, approximately $134 per square foot. 933 Mays Bridge Rd SW is a home located in Floyd County with nearby schools including Coosa Middle School and Coosa High School.
Ownership History
Date
Name
Owned For
Owner Type
Purchase Details
Closed on
Jun 5, 2002
Sold by
Gable Beverly K
Bought by
Gable Beverly K and Gable Michael A
Current Estimated Value
Purchase Details
Closed on
Feb 19, 1999
Sold by
Littlejohn Beverly K
Bought by
Gable Beverly K
Purchase Details
Closed on
Nov 11, 1994
Sold by
Beverly K Littlejohn
Bought by
Littlejohn Beverly K
Purchase Details
Closed on
Jan 11, 1985
Sold by
Maddox Stephen W and Maddox Myra P
Bought by
Littlejohn Jackie L
Purchase Details
Closed on
Jul 11, 1983
Sold by
P\R
Bought by
Maddox Stephen W and Maddox Myra P
Purchase Details
Closed on
Feb 3, 1983
Sold by
Foster David T and Foster Elta B
Bought by
P\R
Purchase Details
Closed on
Jun 16, 1980
Sold by
Clark Susan E F
Bought by
Foster David T and Foster Elta B
Purchase Details
Closed on
Jan 30, 1979
Sold by
Clark James H
Bought by
Clark Susan E F
Purchase Details
Closed on
Jun 22, 1973
Sold by
P\R
Bought by
Clark James H
Purchase Details
Closed on
Feb 12, 1973
Sold by
Tyler Huey
Bought by
P\R
Create a Home Valuation Report for This Property
The Home Valuation Report is an in-depth analysis detailing your home's value as well as a comparison with similar homes in the area
Home Values in the Area
Average Home Value in this Area
Purchase History
| Date | Buyer | Sale Price | Title Company |
|---|---|---|---|
| Gable Beverly K | -- | -- | |
| Gable Beverly K | -- | -- | |
| Littlejohn Beverly K | -- | -- | |
| Littlejohn Jackie L | $44,400 | -- | |
| Beverly K Littlejohn | -- | -- | |
| Maddox Stephen W | $39,900 | -- | |
| P\R | -- | -- | |
| Foster David T | $37,200 | -- | |
| Clark Susan E F | -- | -- | |
| Clark James H | $29,900 | -- | |
| P\R | $3,500 | -- | |
| Tyler Huey | -- | -- |
Source: Public Records
Tax History Compared to Growth
Tax History
| Year | Tax Paid | Tax Assessment Tax Assessment Total Assessment is a certain percentage of the fair market value that is determined by local assessors to be the total taxable value of land and additions on the property. | Land | Improvement |
|---|---|---|---|---|
| 2024 | $2,495 | $81,656 | $4,858 | $76,798 |
| 2023 | $2,284 | $79,658 | $4,416 | $75,242 |
| 2022 | $1,965 | $66,220 | $3,643 | $62,577 |
| 2021 | $1,418 | $46,995 | $3,316 | $43,679 |
| 2020 | $1,370 | $45,020 | $2,884 | $42,136 |
| 2019 | $1,298 | $43,232 | $2,884 | $40,348 |
| 2018 | $1,244 | $41,354 | $2,746 | $38,608 |
| 2017 | $1,216 | $40,348 | $2,543 | $37,805 |
| 2016 | $1,214 | $39,774 | $2,520 | $37,254 |
| 2015 | $1,187 | $39,774 | $2,520 | $37,254 |
| 2014 | $1,187 | $39,774 | $2,520 | $37,254 |
Source: Public Records
Map
Nearby Homes
- 26 Red Fox Dr SW
- 5 Red Fox Dr SW
- 458 Kraftsman Rd SW
- 10 Eagle Dr NW
- 63 Highlander Trail SW
- 8 Kayla Dr NW
- 48 Highlander Trail SW
- 14 Bryan Springs Rd SW
- 0 Ausburn Rd SW Unit 10611100
- 43 Brownlow Dr NW
- 0 Alabama Hwy Unit 7494552
- 0 Alabama Hwy Unit 7635346
- 0 Alabama Hwy Unit 10590171
- 3 Cedar Ln NW
- 3 SW Highlander Trail SW
- 48 Atwood Dr NW
- 0 Barker Rd SW Unit 10651788
- 0 Barker Rd SW Unit LotWP001
- 33 Cedar Ln NW
- 293 N Avery Rd NW
- 1090 Mays Bridge Rd SW
- 917 Mays Bridge Rd SW
- 953 Mays Bridge Rd SW
- 32 Red Fox Dr SW
- 14 Fox Hill Dr SW
- 969 Mays Bridge Rd SW
- 35 Red Fox Dr SW
- 33 Red Fox Dr SW
- 901 Mays Bridge Rd SW
- 901 Mays Bridge Rd SW
- 29 Red Fox Dr SW
- 875 Mays Bridge Rd SW
- 930 Mays Bridge Rd SW
- 930 Mays Bridge Rd SW
- 11 Fox Hill Drive Extension SW
- 910 Mays Bridge Rd SW
- 865 Mays Bridge Rd SW
- 924 Mays Bridge Rd SW
- 853 Mays Bridge Rd SW
- 12 Fox Hill Dr SW