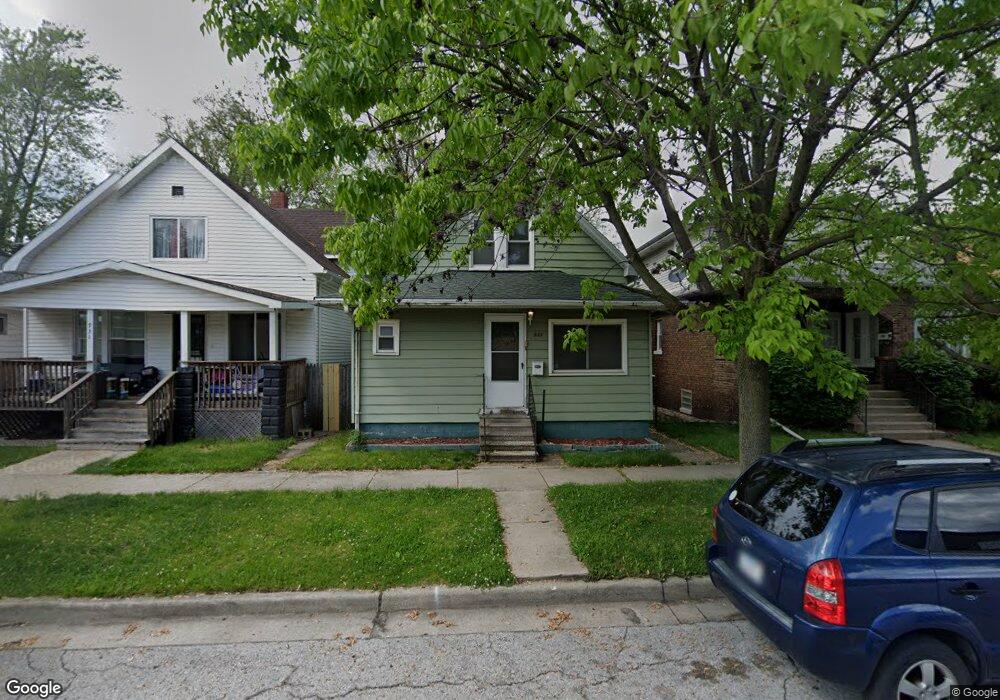
933 Morris St Hammond, IN 46320
Estimated Value: $166,000 - $205,000
4
Beds
2
Baths
1,782
Sq Ft
$102/Sq Ft
Est. Value
About This Home
This home is located at 933 Morris St, Hammond, IN 46320 and is currently estimated at $181,096, approximately $101 per square foot. 933 Morris St is a home located in Lake County with nearby schools including Maywood Elementary School, Eggers Middle School, and Hammond High School.
Ownership History
Date
Name
Owned For
Owner Type
Purchase Details
Closed on
Aug 29, 2024
Sold by
Pfn Partners Llc
Bought by
Marroquin Jan C Guerra
Current Estimated Value
Home Financials for this Owner
Home Financials are based on the most recent Mortgage that was taken out on this home.
Original Mortgage
$173,655
Outstanding Balance
$171,169
Interest Rate
6.77%
Mortgage Type
VA
Estimated Equity
$9,927
Purchase Details
Closed on
Feb 28, 2023
Sold by
Hammond Regional Development Llc
Bought by
Pfn Partners Llc
Purchase Details
Closed on
Jan 12, 2023
Sold by
Hammond Regional Development Llc
Bought by
Pfn Partners Llc
Purchase Details
Closed on
Dec 27, 2011
Sold by
Hsbc Mortgage Services Inc
Bought by
Hammond Regional Development Llc
Purchase Details
Closed on
Sep 10, 2011
Sold by
Perkins Vanessa R and Royal Nicole L
Bought by
Hsbc Mortgage Services Inc
Create a Home Valuation Report for This Property
The Home Valuation Report is an in-depth analysis detailing your home's value as well as a comparison with similar homes in the area
Home Values in the Area
Average Home Value in this Area
Purchase History
| Date | Buyer | Sale Price | Title Company |
|---|---|---|---|
| Marroquin Jan C Guerra | -- | Meridian Title | |
| Pfn Partners Llc | -- | -- | |
| Pfn Partners Llc | -- | None Listed On Document | |
| Hammond Regional Development Llc | -- | None Available | |
| Hsbc Mortgage Services Inc | -- | None Available |
Source: Public Records
Mortgage History
| Date | Status | Borrower | Loan Amount |
|---|---|---|---|
| Open | Marroquin Jan C Guerra | $173,655 |
Source: Public Records
Tax History
| Year | Tax Paid | Tax Assessment Tax Assessment Total Assessment is a certain percentage of the fair market value that is determined by local assessors to be the total taxable value of land and additions on the property. | Land | Improvement |
|---|---|---|---|---|
| 2025 | $1,951 | $133,300 | $17,100 | $116,200 |
| 2024 | $3,308 | $113,600 | $17,100 | $96,500 |
| 2023 | $1,758 | $69,200 | $18,600 | $50,600 |
| 2022 | $1,758 | $65,600 | $18,600 | $47,000 |
| 2021 | $1,277 | $47,100 | $6,200 | $40,900 |
| 2020 | $1,078 | $39,500 | $6,200 | $33,300 |
| 2019 | $1,086 | $35,900 | $6,200 | $29,700 |
| 2018 | $1,126 | $34,800 | $6,200 | $28,600 |
| 2017 | $2,037 | $56,200 | $6,200 | $50,000 |
| 2016 | $1,029 | $32,000 | $6,200 | $25,800 |
| 2014 | $1,535 | $49,000 | $6,200 | $42,800 |
| 2013 | $1,459 | $49,200 | $6,200 | $43,000 |
Source: Public Records
Map
Nearby Homes
- 920 Highland St
- 924 Highland St
- 904 Field St
- 1128 Highland St
- 830 Becker St
- 911 Conkey St
- 909 Conkey St
- 1137 Lyons St
- 1016 Ames St
- 5901 Columbia Ave
- 5856 Wallace Rd
- 1007 Moss St
- 6244 Madison Ave
- 1019 Cleveland St
- 6130 Van Buren Ave Unit 32
- 5631 Alice St
- 922 Summer St
- 1360 Sherman St
- 5632 Claude Ave
- 1119 Sibley St
Your Personal Tour Guide
Ask me questions while you tour the home.