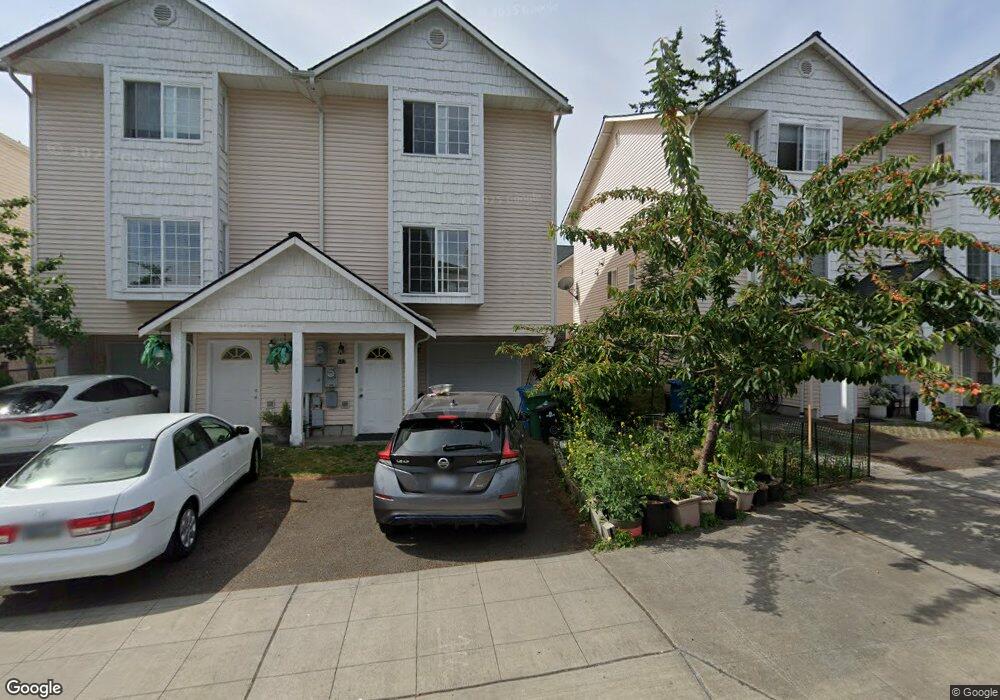
933 N 199th St Unit 49826 Shoreline, WA 98133
Hillwood NeighborhoodEstimated Value: $506,000 - $598,000
3
Beds
2
Baths
1,391
Sq Ft
$396/Sq Ft
Est. Value
About This Home
This home is located at 933 N 199th St Unit 49826, Shoreline, WA 98133 and is currently estimated at $550,342, approximately $395 per square foot. 933 N 199th St Unit 49826 is a home located in King County with nearby schools including Echo Lake Elementary School, Albert Einstein Middle School, and Shorewood High School.
Ownership History
Date
Name
Owned For
Owner Type
Purchase Details
Closed on
Jul 11, 2019
Sold by
Zineb Lamles Nabil and Zineb Lakhilifi
Bought by
Li Wai Yin
Current Estimated Value
Purchase Details
Closed on
Feb 25, 2005
Sold by
Tan Pen Pen
Bought by
Lamles Nabil and Lakhlifi Zineb
Home Financials for this Owner
Home Financials are based on the most recent Mortgage that was taken out on this home.
Original Mortgage
$172,000
Interest Rate
5.87%
Purchase Details
Closed on
Sep 16, 2002
Sold by
Tan Fifi and Tan Thing Thing
Bought by
Tan Pen Pen
Home Financials for this Owner
Home Financials are based on the most recent Mortgage that was taken out on this home.
Original Mortgage
$105,000
Interest Rate
4.37%
Purchase Details
Closed on
Jun 28, 2000
Sold by
Tan Fifi
Bought by
Tan Fifi and Tan Thing Thing
Create a Home Valuation Report for This Property
The Home Valuation Report is an in-depth analysis detailing your home's value as well as a comparison with similar homes in the area
Home Values in the Area
Average Home Value in this Area
Purchase History
| Date | Buyer | Sale Price | Title Company |
|---|---|---|---|
| Li Wai Yin | $442,000 | Nextitle A Title & Escrow Co | |
| Lamles Nabil | $215,000 | First American | |
| Tan Pen Pen | -- | Chicago Title | |
| Tan Fifi | -- | Chicago Title |
Source: Public Records
Mortgage History
| Date | Status | Borrower | Loan Amount |
|---|---|---|---|
| Previous Owner | Lamles Nabil | $172,000 | |
| Previous Owner | Tan Pen Pen | $105,000 | |
| Closed | Lamles Nabil | $43,000 |
Source: Public Records
Tax History Compared to Growth
Tax History
| Year | Tax Paid | Tax Assessment Tax Assessment Total Assessment is a certain percentage of the fair market value that is determined by local assessors to be the total taxable value of land and additions on the property. | Land | Improvement |
|---|---|---|---|---|
| 2024 | $5,400 | $486,000 | $69,100 | $416,900 |
| 2023 | $4,377 | $467,000 | $69,100 | $397,900 |
| 2022 | $4,869 | $408,000 | $69,100 | $338,900 |
| 2021 | $5,172 | $416,000 | $69,100 | $346,900 |
| 2020 | $4,572 | $405,000 | $69,100 | $335,900 |
| 2018 | $4,320 | $359,000 | $69,100 | $289,900 |
| 2017 | $3,771 | $344,000 | $60,400 | $283,600 |
| 2016 | $3,434 | $313,000 | $60,400 | $252,600 |
| 2015 | $2,874 | $273,000 | $63,900 | $209,100 |
| 2014 | -- | $215,000 | $63,900 | $151,100 |
| 2013 | -- | $153,000 | $60,400 | $92,600 |
Source: Public Records
Map
Nearby Homes
- 19821 Whitman Place N
- 1415 N 200th St Unit B1
- 19414 Aurora Ave N Unit 107
- 19414 Aurora Ave N Unit 203
- 604 N 201st St
- 8515 244th St SW Unit A4
- 8515 244th St SW Unit A2
- 1621 N 201st St
- 8517 242nd St SW Unit 402
- 19002 Ashworth Ave N
- 7914 242nd St SW
- 537 N 188th St
- 18525 Firlands Way N
- 18542 Stone Ave N
- 18534 Stone Ave N
- 7903 240th St SW
- 7901 240th St SW
- 303 NW 203rd St
- 7905 240th St SW
- 324 NW 195th St
- 933 N 199th St
- 933 N 199th St Unit 2937
- 933 N 199th St Unit 933
- 933 N 199th St Unit 49828
- 933 N 199th St Unit 39822
- 933 N 199th St Unit 39820
- 933 N 199th St Unit 2939
- 933 N 199th St Unit 935
- 935 N 199th St
- 19826 Whitman Place N
- 19826 Whitman Place N
- 929 N 199th St
- 19822 Whitman Place N
- 19820 Whitman Place N Unit 19820
- 939 N 199th St
- 927 N 199th St
- 940 N 199th St
- 925 N 199th St
- 938 N 199th St
- 936 N 199th St