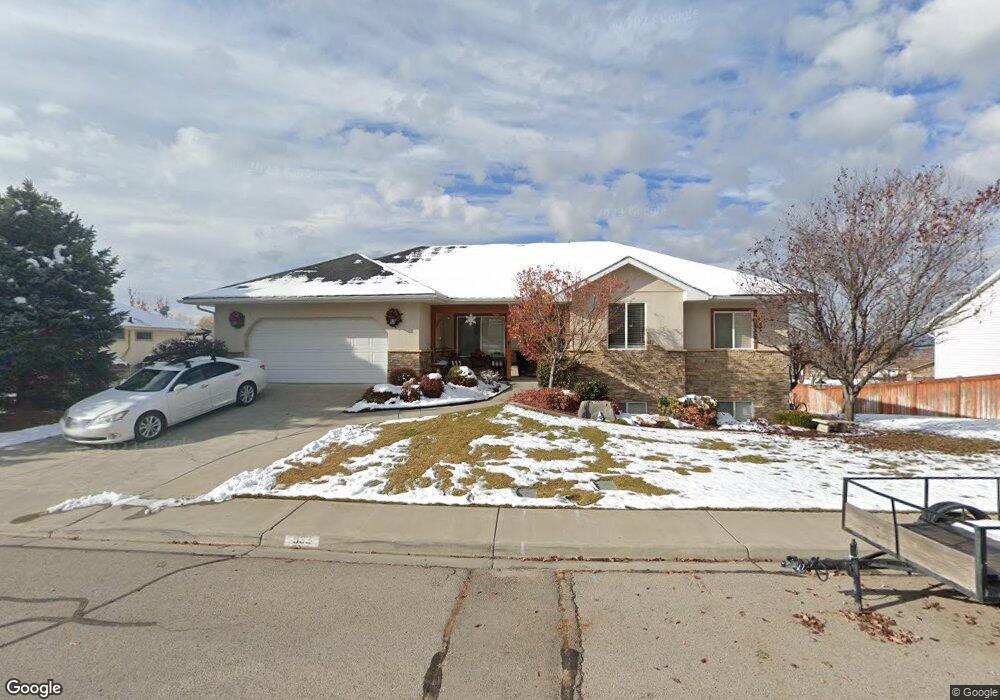
933 N 600 E Pleasant Grove, UT 84062
Estimated Value: $528,000 - $624,701
3
Beds
3
Baths
3,490
Sq Ft
$164/Sq Ft
Est. Value
About This Home
This home is located at 933 N 600 E, Pleasant Grove, UT 84062 and is currently estimated at $571,234, approximately $163 per square foot. 933 N 600 E is a home located in Utah County with nearby schools including Grovecrest Elementary School, Pleasant Grove Junior High School, and Pleasant Grove High School.
Ownership History
Date
Name
Owned For
Owner Type
Purchase Details
Closed on
Aug 31, 2005
Sold by
Bushman Nathan S and Bushman Heather L
Bought by
Scott Lance C
Current Estimated Value
Home Financials for this Owner
Home Financials are based on the most recent Mortgage that was taken out on this home.
Original Mortgage
$227,620
Outstanding Balance
$120,166
Interest Rate
5.64%
Mortgage Type
Fannie Mae Freddie Mac
Estimated Equity
$451,068
Purchase Details
Closed on
Apr 9, 2004
Sold by
Bushman Heather Lancaster
Bought by
Bushman Nathan S and Bushman Heather L
Purchase Details
Closed on
Jul 31, 2003
Sold by
Bushman Nathan S
Bought by
Bushman Nathan S and Bushman Heather Lancaster
Purchase Details
Closed on
Nov 6, 2002
Sold by
Dommer David and Dommer Joanne B
Bought by
Bushman Nathan S
Home Financials for this Owner
Home Financials are based on the most recent Mortgage that was taken out on this home.
Original Mortgage
$180,000
Interest Rate
5.88%
Create a Home Valuation Report for This Property
The Home Valuation Report is an in-depth analysis detailing your home's value as well as a comparison with similar homes in the area
Home Values in the Area
Average Home Value in this Area
Purchase History
| Date | Buyer | Sale Price | Title Company |
|---|---|---|---|
| Scott Lance C | -- | Horizon Title Insurance | |
| Bushman Nathan S | -- | -- | |
| Bushman Nathan S | -- | Horizon Title | |
| Bushman Nathan S | -- | Horizon Title |
Source: Public Records
Mortgage History
| Date | Status | Borrower | Loan Amount |
|---|---|---|---|
| Open | Scott Lance C | $227,620 | |
| Previous Owner | Bushman Nathan S | $180,000 |
Source: Public Records
Tax History
| Year | Tax Paid | Tax Assessment Tax Assessment Total Assessment is a certain percentage of the fair market value that is determined by local assessors to be the total taxable value of land and additions on the property. | Land | Improvement |
|---|---|---|---|---|
| 2025 | $2,571 | $324,280 | -- | -- |
| 2024 | $2,571 | $300,025 | $0 | $0 |
| 2023 | $2,448 | $299,035 | $0 | $0 |
| 2022 | $2,671 | $324,665 | $0 | $0 |
| 2021 | $2,309 | $427,300 | $164,800 | $262,500 |
| 2020 | $2,126 | $385,700 | $147,100 | $238,600 |
| 2019 | $1,863 | $349,600 | $135,200 | $214,400 |
| 2018 | $1,903 | $337,700 | $123,300 | $214,400 |
| 2017 | $1,736 | $164,010 | $0 | $0 |
| 2016 | $1,690 | $154,165 | $0 | $0 |
| 2015 | $1,785 | $154,165 | $0 | $0 |
| 2014 | $1,695 | $145,035 | $0 | $0 |
Source: Public Records
Map
Nearby Homes
Your Personal Tour Guide
Ask me questions while you tour the home.